The most sophisticated forecasting model in the world will produce garbage if you feed it garbage. This isn't a theoretical concern — it's the single most common reason forecasts fail in practice. Before worrying about which algorithm to use or how many external variables to include, you need clean data.
Data cleaning isn't glamorous work. It doesn't appear in vendor demos or feature comparisons. But it's where forecast accuracy is won or lost. A simple model on clean data will outperform a complex model on messy data every time.
This guide covers the practical steps to prepare your sales data for forecasting, the common problems you'll encounter, and how to fix them without a data engineering team.
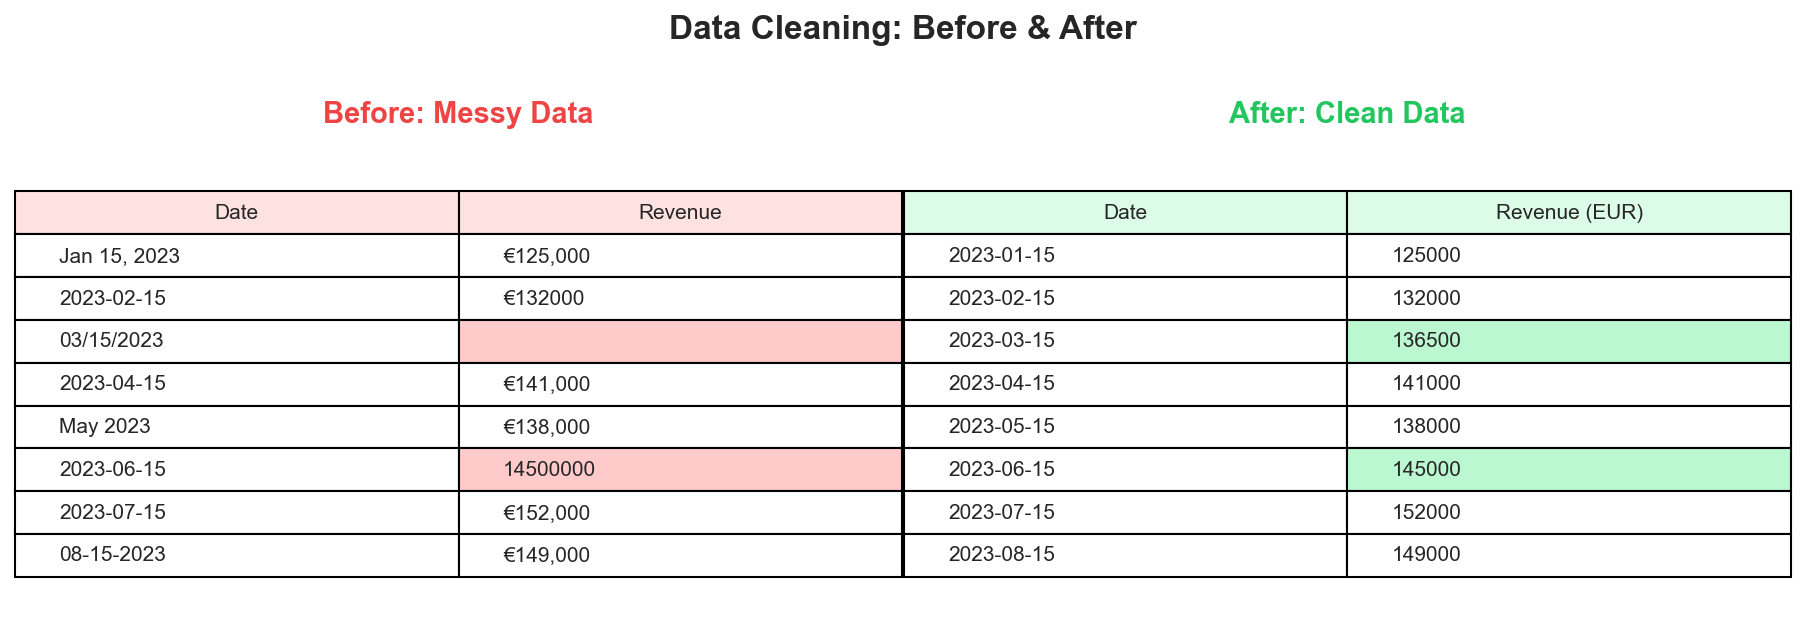 A typical data cleaning transformation: inconsistent dates, missing values, and unit errors become standardized, complete records.
Why Data Quality Matters for Forecasting
Forecasting models learn patterns from historical data. If that history contains errors, gaps, or inconsistencies, the model learns the wrong patterns. The result is a forecast that confidently projects noise rather than signal.
Consider a simple example: your CRM shows zero revenue for March 2023. Was there actually no revenue that month? Or did someone forget to close out the books? Or was there a system migration that lost the data? Each scenario requires a different response, and getting it wrong means your model either learns that March is always zero (wrong) or treats it as missing data when it shouldn't be.
The challenge is that data quality issues are often invisible until they break something. A forecast that's off by 30% might be blamed on market conditions or model selection when the real culprit is a formatting inconsistency in row 847 of the source file.
Start With a Data Audit
Before cleaning anything, understand what you're working with. A quick audit takes 15 minutes and prevents hours of debugging later.
Open your data file and check these basics:
Row count and date range. How many periods do you have? Monthly data should have 12 rows per year. Quarterly should have 4. If you expect 5 years of monthly data but only see 47 rows instead of 60, you have gaps.
Column structure. Is there a clear date column? A clear value column? Are there extra columns that might confuse the analysis? A common issue is having both "Revenue" and "Adjusted Revenue" columns without clarity on which to use.
Value ranges. What's the minimum and maximum? Are there any negative values? Are there any values that are 10x or 100x larger than the rest? These extremes often indicate data entry errors or unit inconsistencies.
Date formatting. Are dates consistent throughout? Mixed formats like "2023-01-15" and "01/15/2023" and "January 15, 2023" in the same column cause parsing failures.
Visual scan. Scroll through the data. Do any rows look obviously wrong? Trust your intuition here — if something looks odd, investigate it.
Handling Missing Values
Missing data is the most common quality issue in business datasets. How you handle it significantly impacts forecast accuracy.
Identify the Type of Missingness
Not all missing data is equal. Understanding why data is missing determines how to handle it.
Missing completely at random. The absence has no pattern — a data entry clerk was sick one day, or a system glitch affected random records. These gaps can usually be imputed without introducing bias.
Missing systematically. The absence has a cause. Maybe Q4 data is always incomplete because books aren't closed until February. Maybe a product line was discontinued so recent months show blanks. Imputing these blindly can introduce serious errors.
Truly zero vs. missing. This is the most dangerous confusion. A blank cell might mean "no data recorded" or "recorded as zero." If December shows blank because the holiday shutdown meant no sales, that's a real zero. If December shows blank because the report wasn't run, that's missing data. The correct handling is opposite in each case.
Imputation Methods
Once you understand why data is missing, choose an appropriate fill method.
Forward fill. Use the last known value. Appropriate when values change infrequently and gaps are short. If November revenue was €100K and December is missing, forward fill assumes €100K. Works poorly for seasonal or volatile data.
Linear interpolation. Draw a line between known points. If October was €90K and December was €110K, interpolation sets November at €100K. Works well for trending data with occasional gaps.
Seasonal average. Use the average of the same period from other years. If March 2023 is missing, average March 2020, 2021, and 2022. Best for strongly seasonal data where the month matters more than the trend.
Leave as missing. Sometimes the honest answer is that you don't know. Many forecasting models can handle occasional missing values natively. Imputing bad guesses can be worse than admitting uncertainty.
When to Drop Data Instead
Sometimes imputation isn't appropriate. Consider dropping rows or shortening your history when:
- More than 20% of a period's data is missing
- The missing period contains known anomalies (COVID, major restructuring)
- The gap is at the very beginning or end of your dataset
- You have enough remaining data for reliable modeling
A cleaner, shorter dataset often produces better forecasts than a longer, patched-together one.
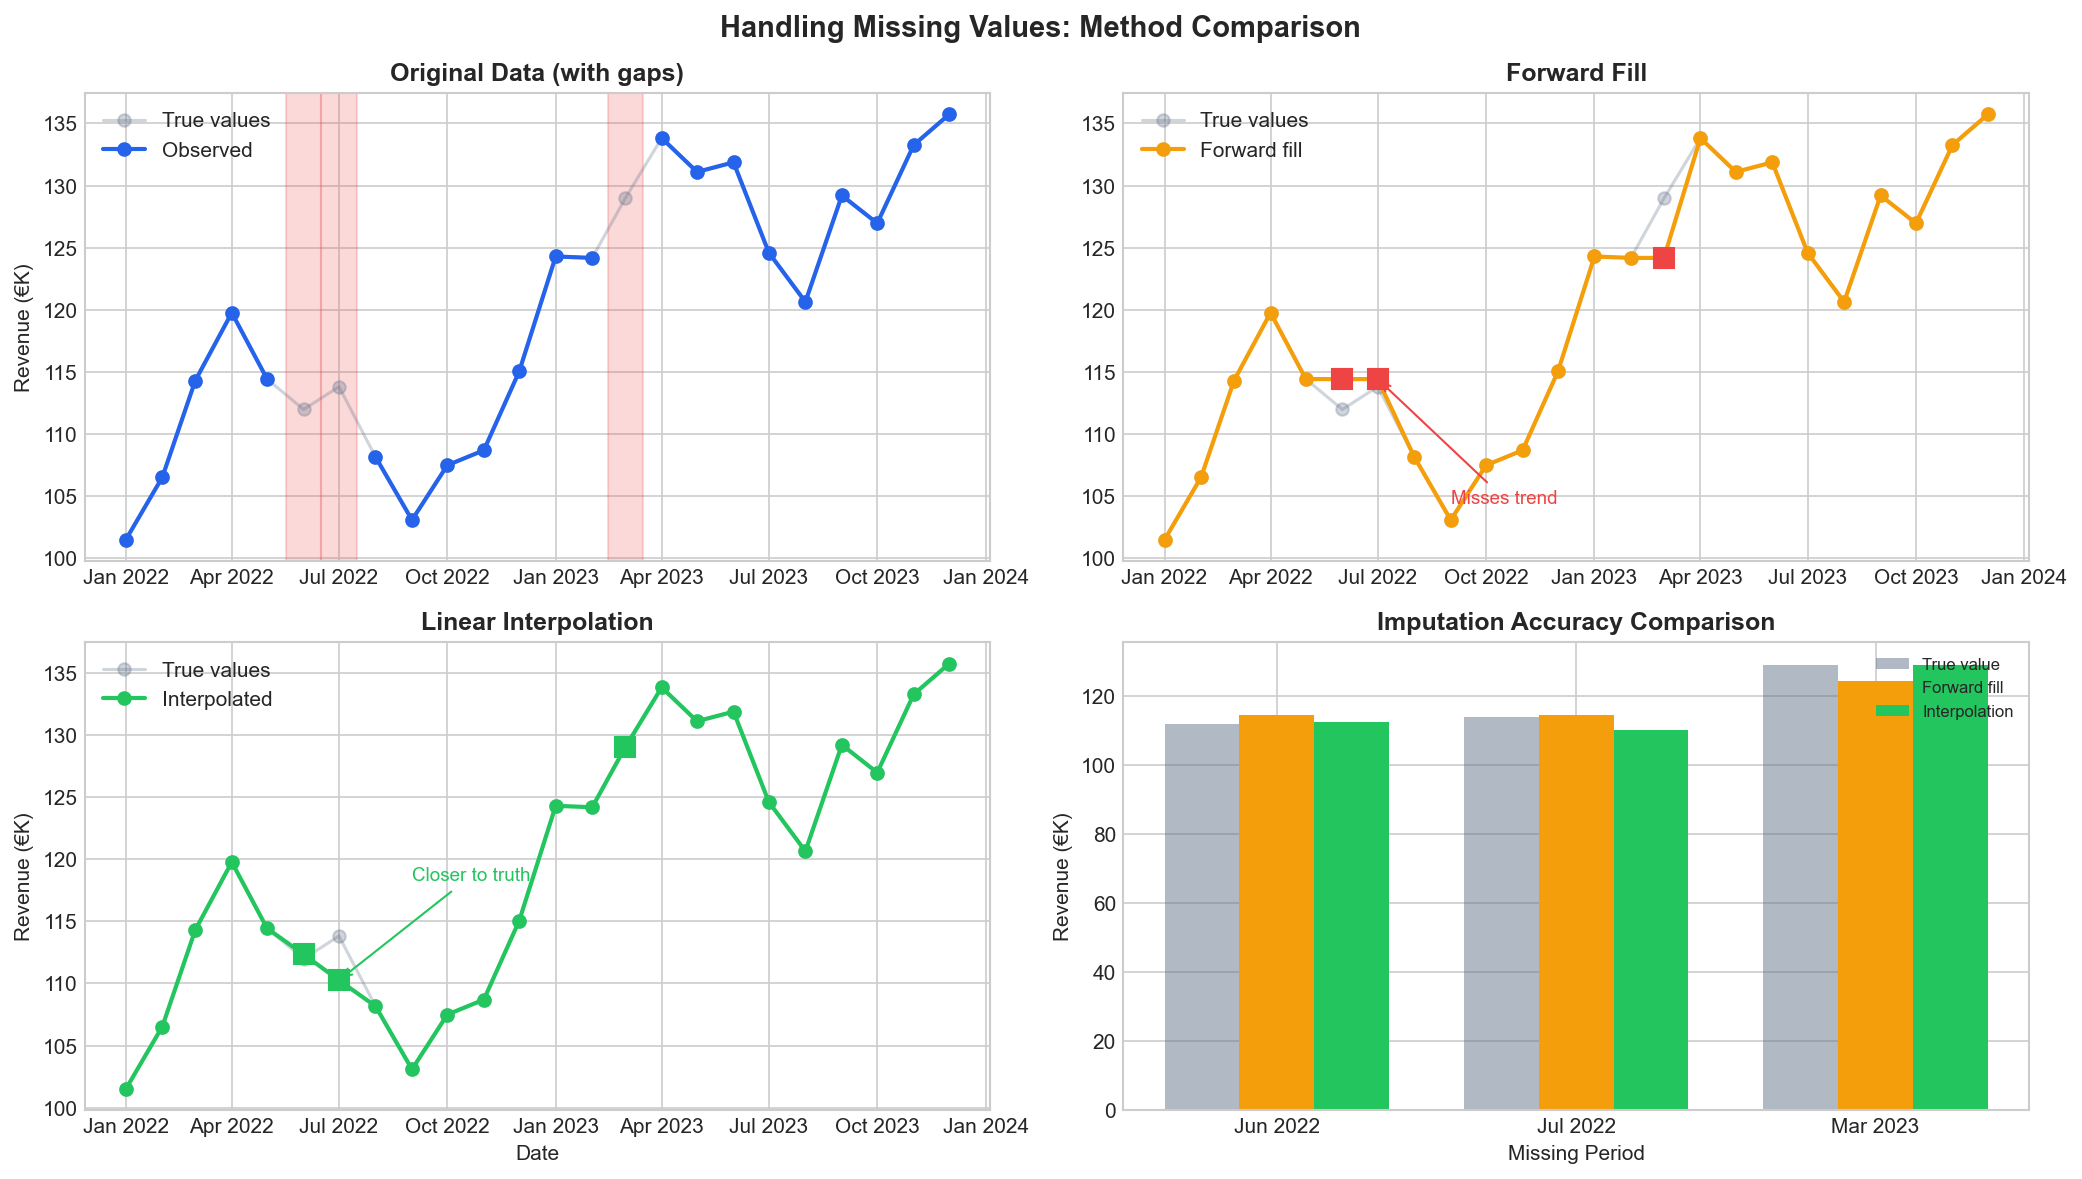 Different imputation methods produce different results. Forward fill preserves the last value but misses trends. Linear interpolation often gets closer to the truth for trending data.
Dealing With Outliers
Outliers are observations that deviate significantly from the pattern. They might be errors, or they might be real events that your forecast should account for.
Detection Methods
Visual inspection. Plot your data as a time series. Points that spike dramatically above or below the trend line are candidates for investigation.
Statistical thresholds. Flag values more than 2-3 standard deviations from the mean. For monthly revenue averaging €100K with €20K standard deviation, anything above €160K or below €40K warrants a look.
Business context. Some outliers make sense. A December spike for a retailer isn't an error — it's seasonality. A February spike with no obvious explanation needs investigation.
Handling Approaches
Verify before removing. An apparent outlier might be correct. That huge Q3 number might reflect a real one-time deal. Removing valid data points degrades forecast accuracy.
Correct obvious errors. A revenue figure of €1,000,000,000 when normal values are €1,000,000 is likely a decimal error. Fix the source data rather than working around it.
Cap or winsorize. Replace extreme values with a threshold percentile. If your 95th percentile is €150K, replace anything above that with €150K. This preserves the signal that "this was a high month" without letting one extreme observation dominate the model.
Flag and model separately. For known one-time events (acquisition, divestiture, pandemic), flag them in a separate column rather than modifying the value. Good forecasting tools can incorporate these flags to distinguish recurring patterns from one-offs.
 Not all outliers are errors. The "one-time deal" at €155K is real business activity worth capping, while the €180K and €45K values are data errors that should be removed and interpolated.
Date and Time Formatting
Date inconsistencies cause more silent failures than any other data issue. A forecasting model expecting "2023-01-15" will fail unpredictably on "01/15/2023" — sometimes crashing, sometimes producing nonsense results without warning.
Common Date Problems
Mixed formats. Different rows using different conventions. Often happens when data is compiled from multiple sources or when a spreadsheet auto-formats some cells differently.
Text vs. date types. Excel might display "01/15/2023" but store it as text string rather than a date value. The visual appearance is identical; the computational behavior is not.
Ambiguous formats. Is "01/02/2023" January 2nd or February 1st? Depends on locale. American, European, and ISO conventions all differ.
Missing time zones. Less relevant for monthly aggregates, but critical for daily or hourly data. A dataset spanning multiple time zones without standardization will have subtle errors.
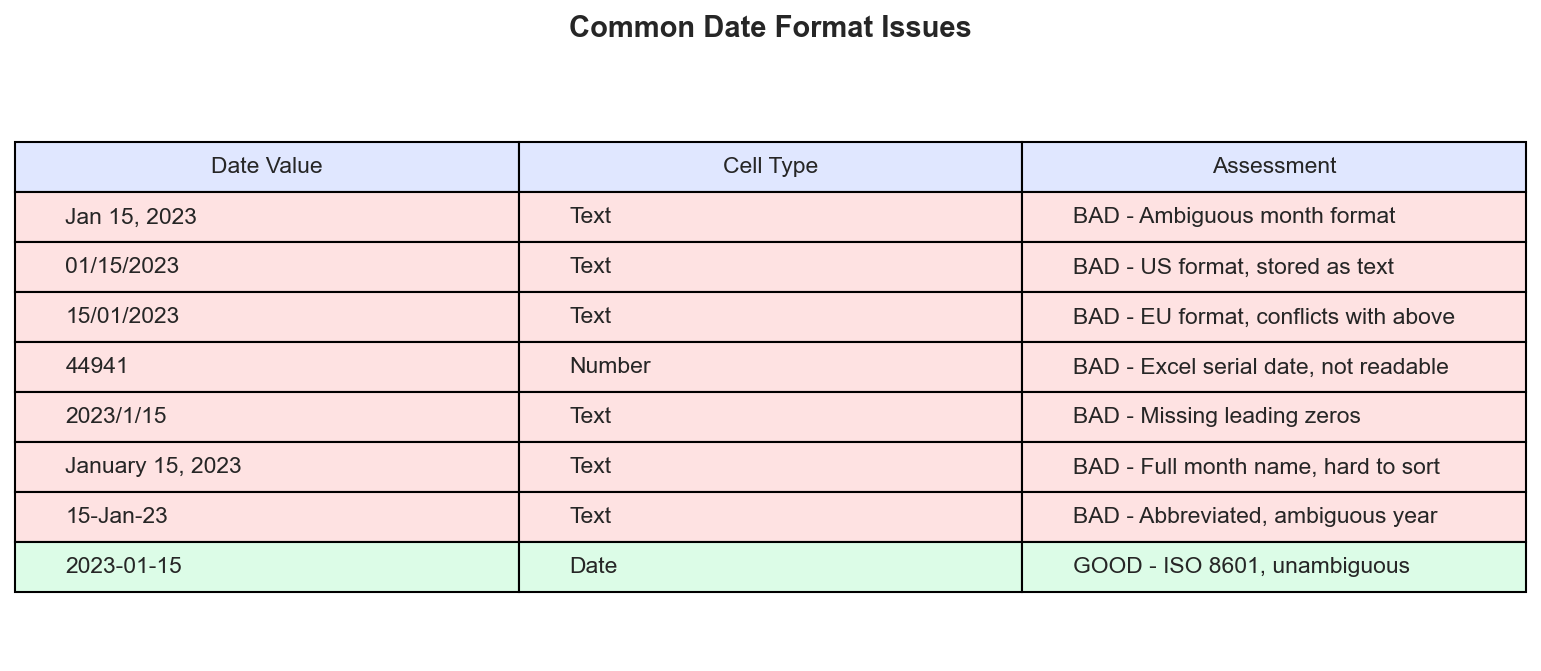 The same date expressed eight different ways. Only ISO 8601 format (YYYY-MM-DD) is unambiguous and sorts correctly.
Standardization Steps
Convert all dates to ISO 8601 format: YYYY-MM-DD. This format is unambiguous, sorts correctly, and is universally parseable.
In Excel:
- Select the date column
- Format Cells → Custom → "YYYY-MM-DD"
- Check that all values converted correctly (text-formatted dates won't convert automatically)
For text-formatted dates, you may need a formula to reconstruct them:
=DATE(RIGHT(A1,4), MID(A1,4,2), LEFT(A1,2))
Always verify by sorting the date column. If dates don't sort chronologically, there's still a formatting issue.
Handling Aggregation Mismatches
Forecasting requires consistent time granularity. Mixing weekly and monthly data, or having some months with daily detail and others with only monthly totals, creates problems.
Common Scenarios
Partial periods. Data that runs through "mid-January" combines one complete month with a partial month. Either exclude the partial period or extrapolate to a full month (with appropriate caution).
Changed granularity. Historical data might be quarterly while recent data is monthly. You can disaggregate the quarterly data (spread evenly across months) or aggregate the monthly data (sum to quarters). Both approaches lose information.
Fiscal vs. calendar alignment. A fiscal year starting in April means Q1 is April-June, not January-March. Ensure your data is consistently labeled.
Best Practice
Choose one granularity and stick with it throughout. Monthly is the most common for sales forecasting — granular enough to capture seasonal patterns but aggregated enough to smooth daily noise.
If you must combine different granularities, aggregate up rather than disaggregate down. Summing weekly data to monthly preserves accuracy. Spreading monthly data to weekly invents false precision.
Structural Breaks and Regime Changes
Not all historical data is equally relevant. Events that fundamentally change your business can make old patterns misleading.
Examples of Structural Breaks
- Acquisition or merger that changed the revenue base
- Divestiture of a product line or region
- Major pricing restructure
- Shift from one-time sales to subscription model
- Expansion into new markets with different seasonality
- Pandemic-related disruptions
How to Handle Them
Truncate history. If your business model fundamentally changed in 2021, data from 2018-2020 may hurt more than help. Start your training data from the new regime.
Normalize to comparable basis. If you acquired a company, you might restate historical revenue to include what the combined entity would have produced. This requires careful pro-forma adjustments.
Model the break explicitly. Include a binary indicator variable that flags "before vs. after" and let the model learn the difference. Works well for single clear breakpoints.
Run separate models. Forecast legacy business and new business separately, then combine. More complex but avoids forcing a single model to reconcile incompatible patterns.
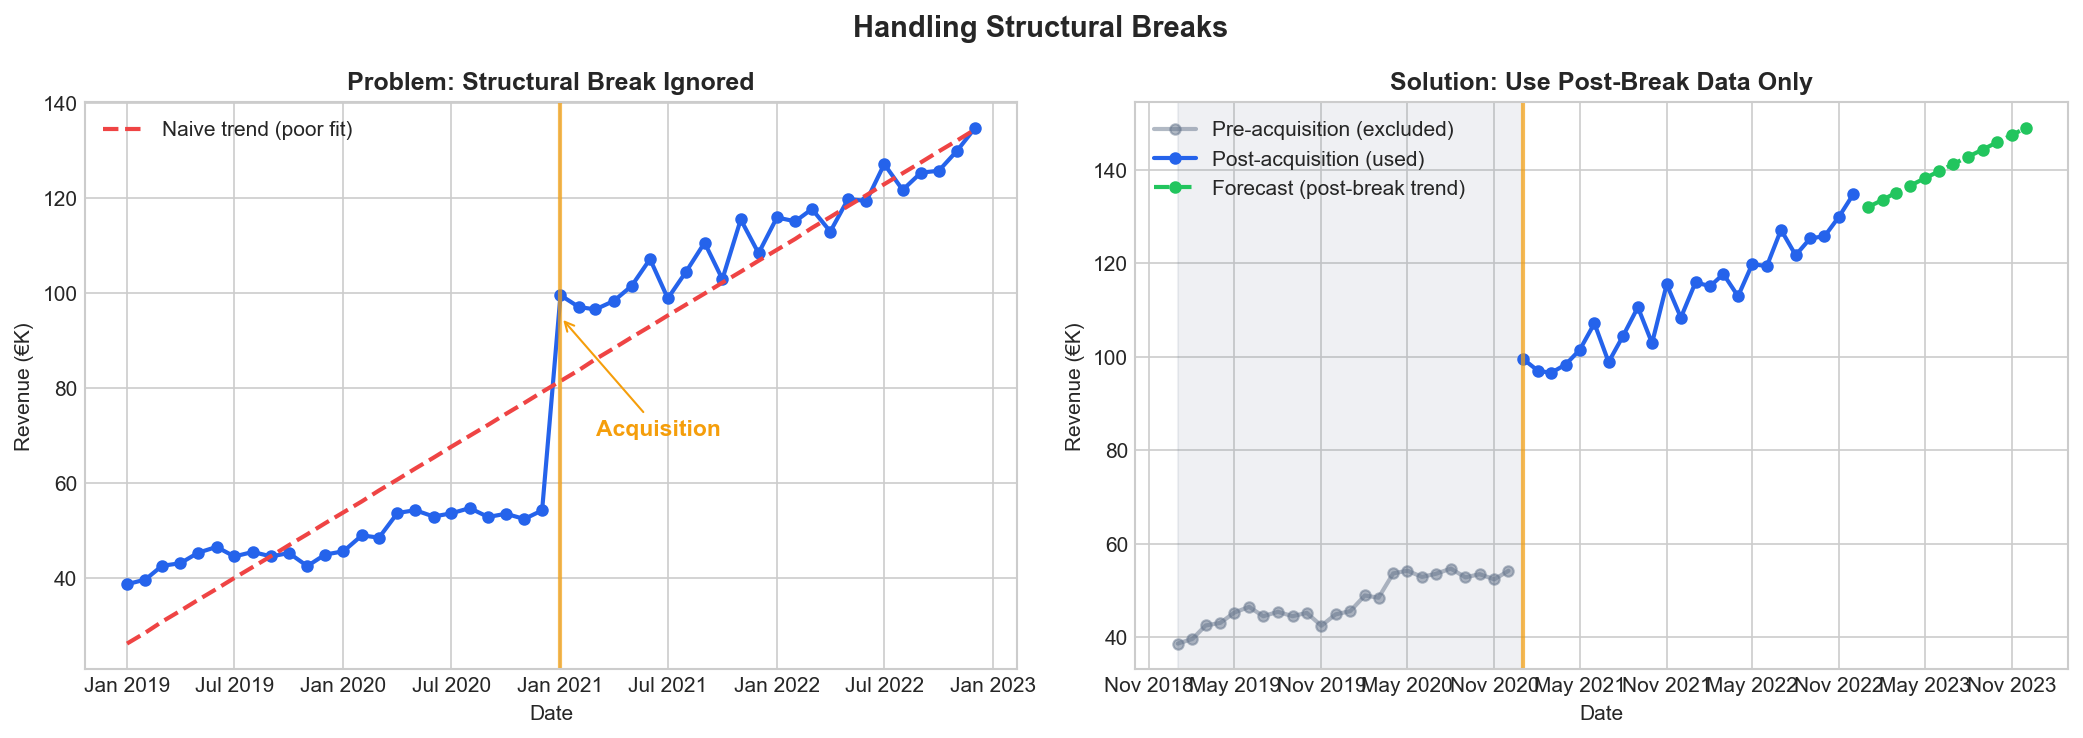 An acquisition in 2021 changed the revenue base. Training on all data produces a poor trend line. Using only post-acquisition data gives a reliable forecast.
Unit and Currency Consistency
This sounds obvious until you discover three months of forecasts are wrong because one year was in thousands and another was in millions.
What to Check
Scale. Is revenue in dollars, thousands, or millions? Is the notation consistent throughout? A switch from explicit figures (€1,234,567) to abbreviated (€1.23M) can cause problems.
Currency. Multi-country data may mix currencies. Decide whether to analyze in local currency or convert everything to a base. Conversion introduces exchange rate complexity.
Units sold vs. revenue. Ensure you're forecasting what you think you are. Volume and revenue can diverge significantly with price changes.
Standardization
Pick one unit convention and document it. Include the unit in your column headers ("Revenue_EUR_Thousands") to prevent ambiguity. When in doubt, use the most granular non-abbreviated form — €1,234,567 rather than €1.23M.
Creating a Repeatable Process
Data cleaning isn't a one-time task. Each time you update your forecast with new data, you need to clean that new data. Build a checklist you can run consistently.
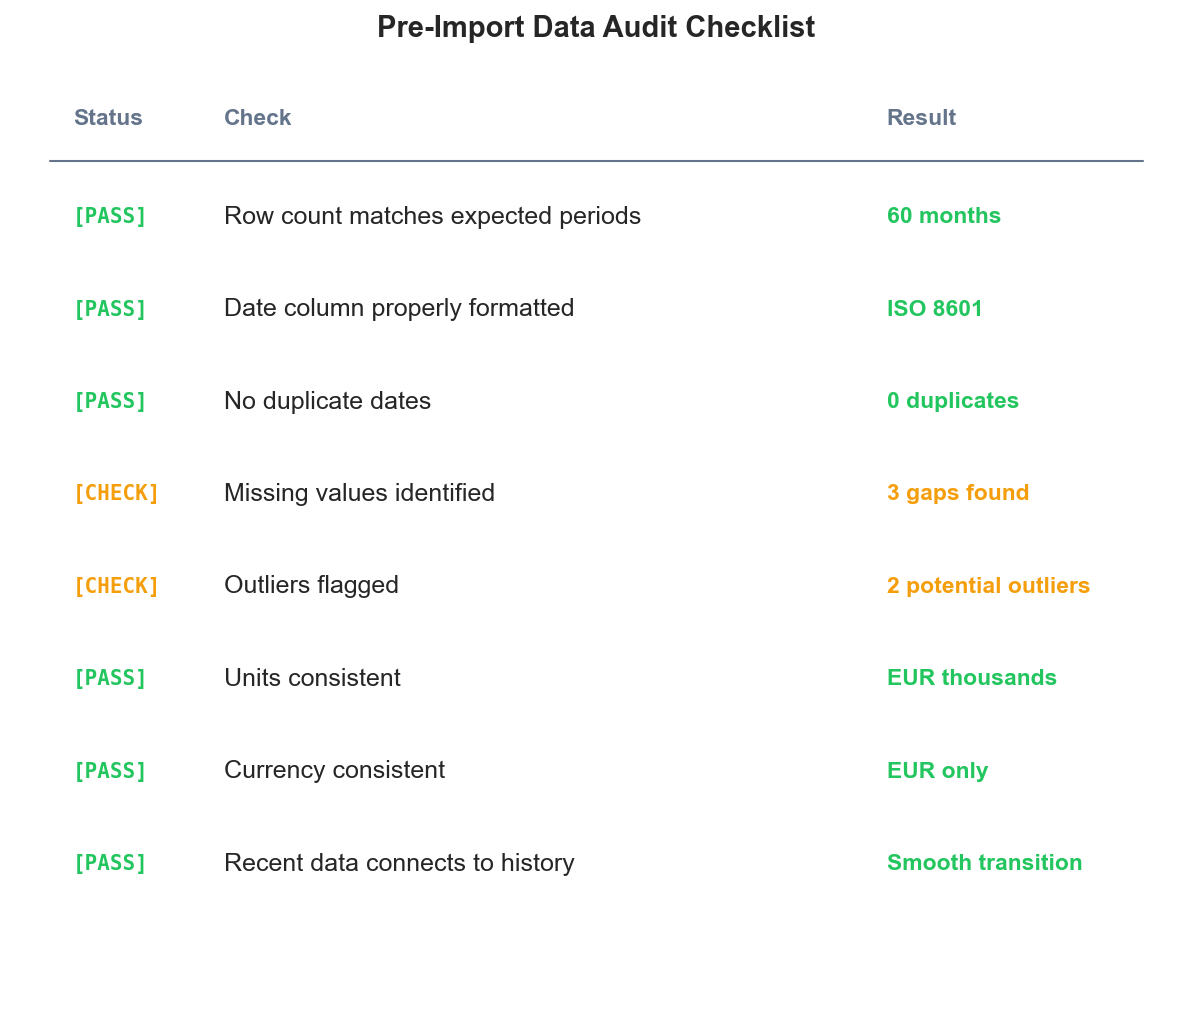 A sample pre-import checklist. Green items pass validation; amber items need attention before forecasting.
Pre-import checklist:
- Verify file format and structure match expectations
- Check row count against expected periods
- Scan for obvious outliers or gaps
- Confirm date column is properly formatted
- Verify units and currency are consistent with historical data
Post-import validation:
- Plot the complete series including new data
- Confirm new data connects smoothly to historical data
- Flag any new periods that seem inconsistent
- Document any adjustments made
Documentation:
Keep a log of every data modification. When next year's forecast is off, you'll want to know what adjustments were made and why. This also protects against "we've always done it this way" tribal knowledge that walks out the door when someone leaves.
Common Mistakes to Avoid
Over-cleaning. Removing every data point that looks unusual can strip out real signal. Aggressive outlier removal often removes exactly the extreme events you want the forecast to account for.
Silent transformations. Excel auto-formatting, copy-paste errors, and formula mistakes can introduce problems that aren't visible without careful inspection. Always verify your cleaned data against the source.
Cleaning to fit expectations. If the data doesn't match your mental model of the business, investigate before changing it. The data might be revealing something you didn't know.
Ignoring metadata. The numbers need context. A revenue dip might be explained by a note in the source system that didn't make it into your export. Work with people who know the business context.
Inconsistent application. If you remove an outlier in one year, apply the same logic to other years. Selective cleaning introduces bias.
The Payoff
Clean data doesn't guarantee accurate forecasts, but dirty data guarantees inaccurate ones. The time invested in data preparation compounds through every forecast cycle. Fix a date formatting issue once and it stays fixed. Document your cleaning process and next quarter takes minutes instead of hours.
For most businesses, data cleaning represents the highest-leverage activity in the entire forecasting process. A few hours of careful preparation enables months of reliable predictions.
Ready to forecast with your clean data? Try Sanvia free for 14 days — upload your prepared dataset and generate forecasts in minutes.