Seasonal Sales Forecasting: How to Predict and Prepare for Demand Swings
Every business has a rhythm. Retailers brace for Q4. Construction companies ramp up in spring. SaaS vendors see a surge in January when budgets reset. HVAC installers know summer and winter are their bread and butter.
Most businesses know their busy season. Few actually build it into their forecasts.
The result? They're always a step behind — understaffed during the rush, overstocked during the lull, scrambling for cash when they should be coasting. Seasonal demand isn't a surprise. It's a pattern. And patterns can be predicted.
This guide shows you how to detect seasonality in your data, quantify it, build a forecast around it, and — most importantly — turn that forecast into operational decisions that actually prepare your business for what's coming.
What Is Seasonal Demand? (And What Isn't)
Before forecasting seasonality, you need to know what you're looking at. Not every spike is seasonal, and confusing different patterns leads to bad forecasts.
Seasonality is a recurring, predictable pattern that repeats at fixed intervals — typically monthly or quarterly within a year. December retail spikes, summer tourism surges, January gym memberships. The key word is recurring. If it happened once, it's not seasonal.
Trend is the long-term direction of your sales — up, down, or flat. A business growing 20% per year has an upward trend. Seasonality rides on top of the trend.
Cyclical patterns repeat, but not on a fixed calendar. Economic cycles, real estate booms, and industry-specific cycles last years, not months, and their timing is irregular.
Noise is everything else — random variation, one-off events, a viral social media post, a competitor's sudden price drop. Noise is unpredictable by definition.
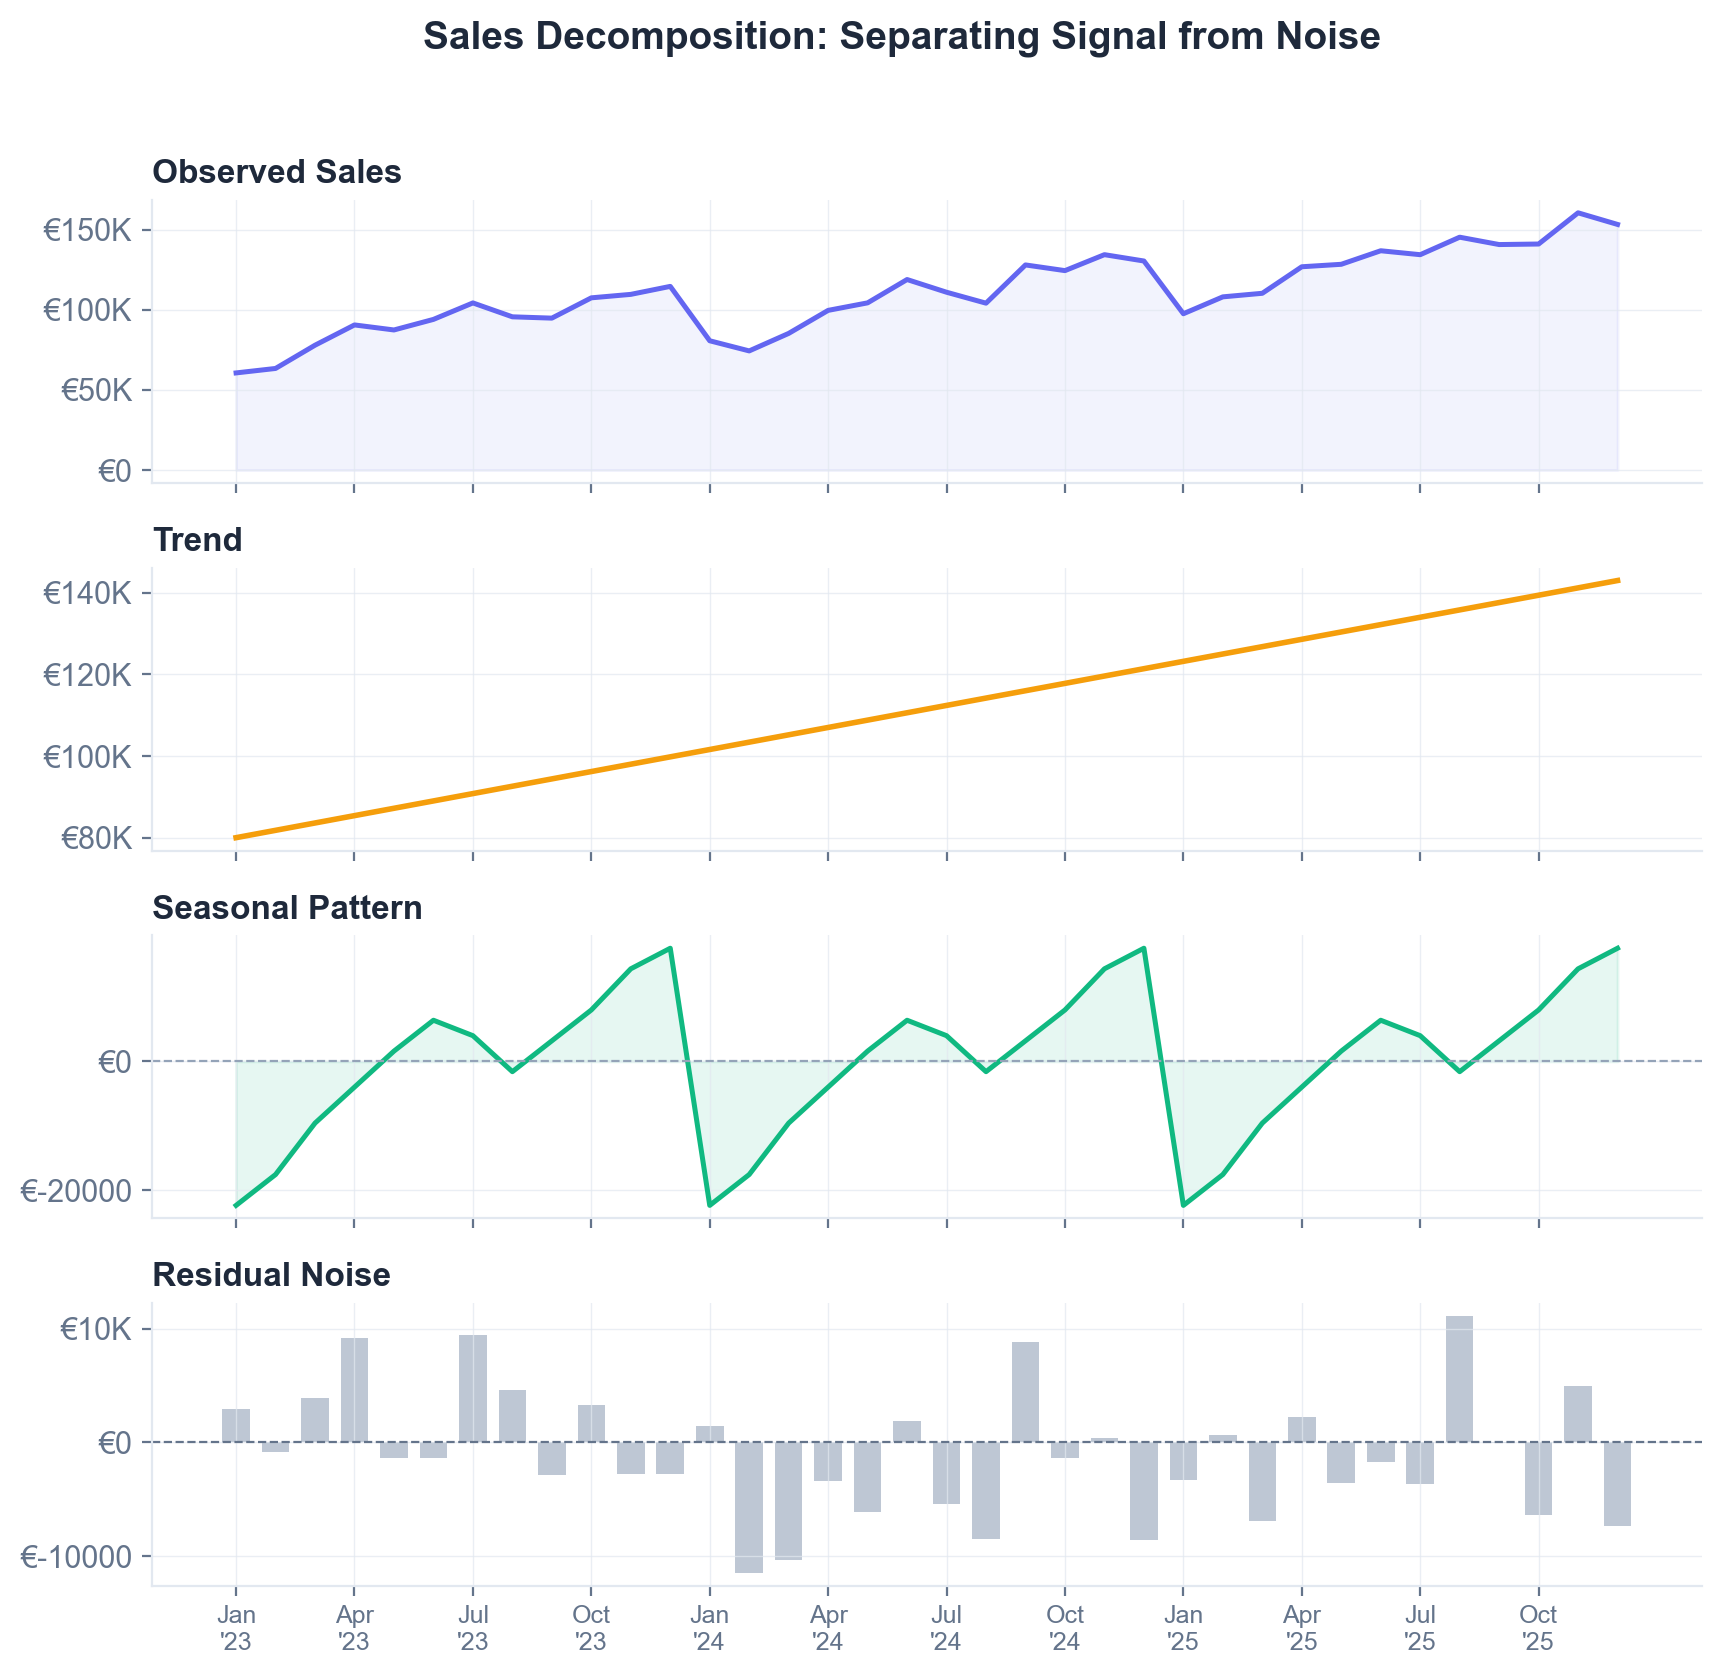
The chart above shows a typical sales series broken into its components. The raw data (top) looks chaotic. But decompose it and you see a clear upward trend, a consistent seasonal wave, and random noise around it. Your job as a forecaster is to separate signal from noise — and seasonality is one of the strongest signals you have.
Why this matters: If you forecast total sales without separating these components, you'll either overreact to noise or miss the seasonal pattern entirely. Both lead to poor decisions.
Common Seasonal Patterns by Industry
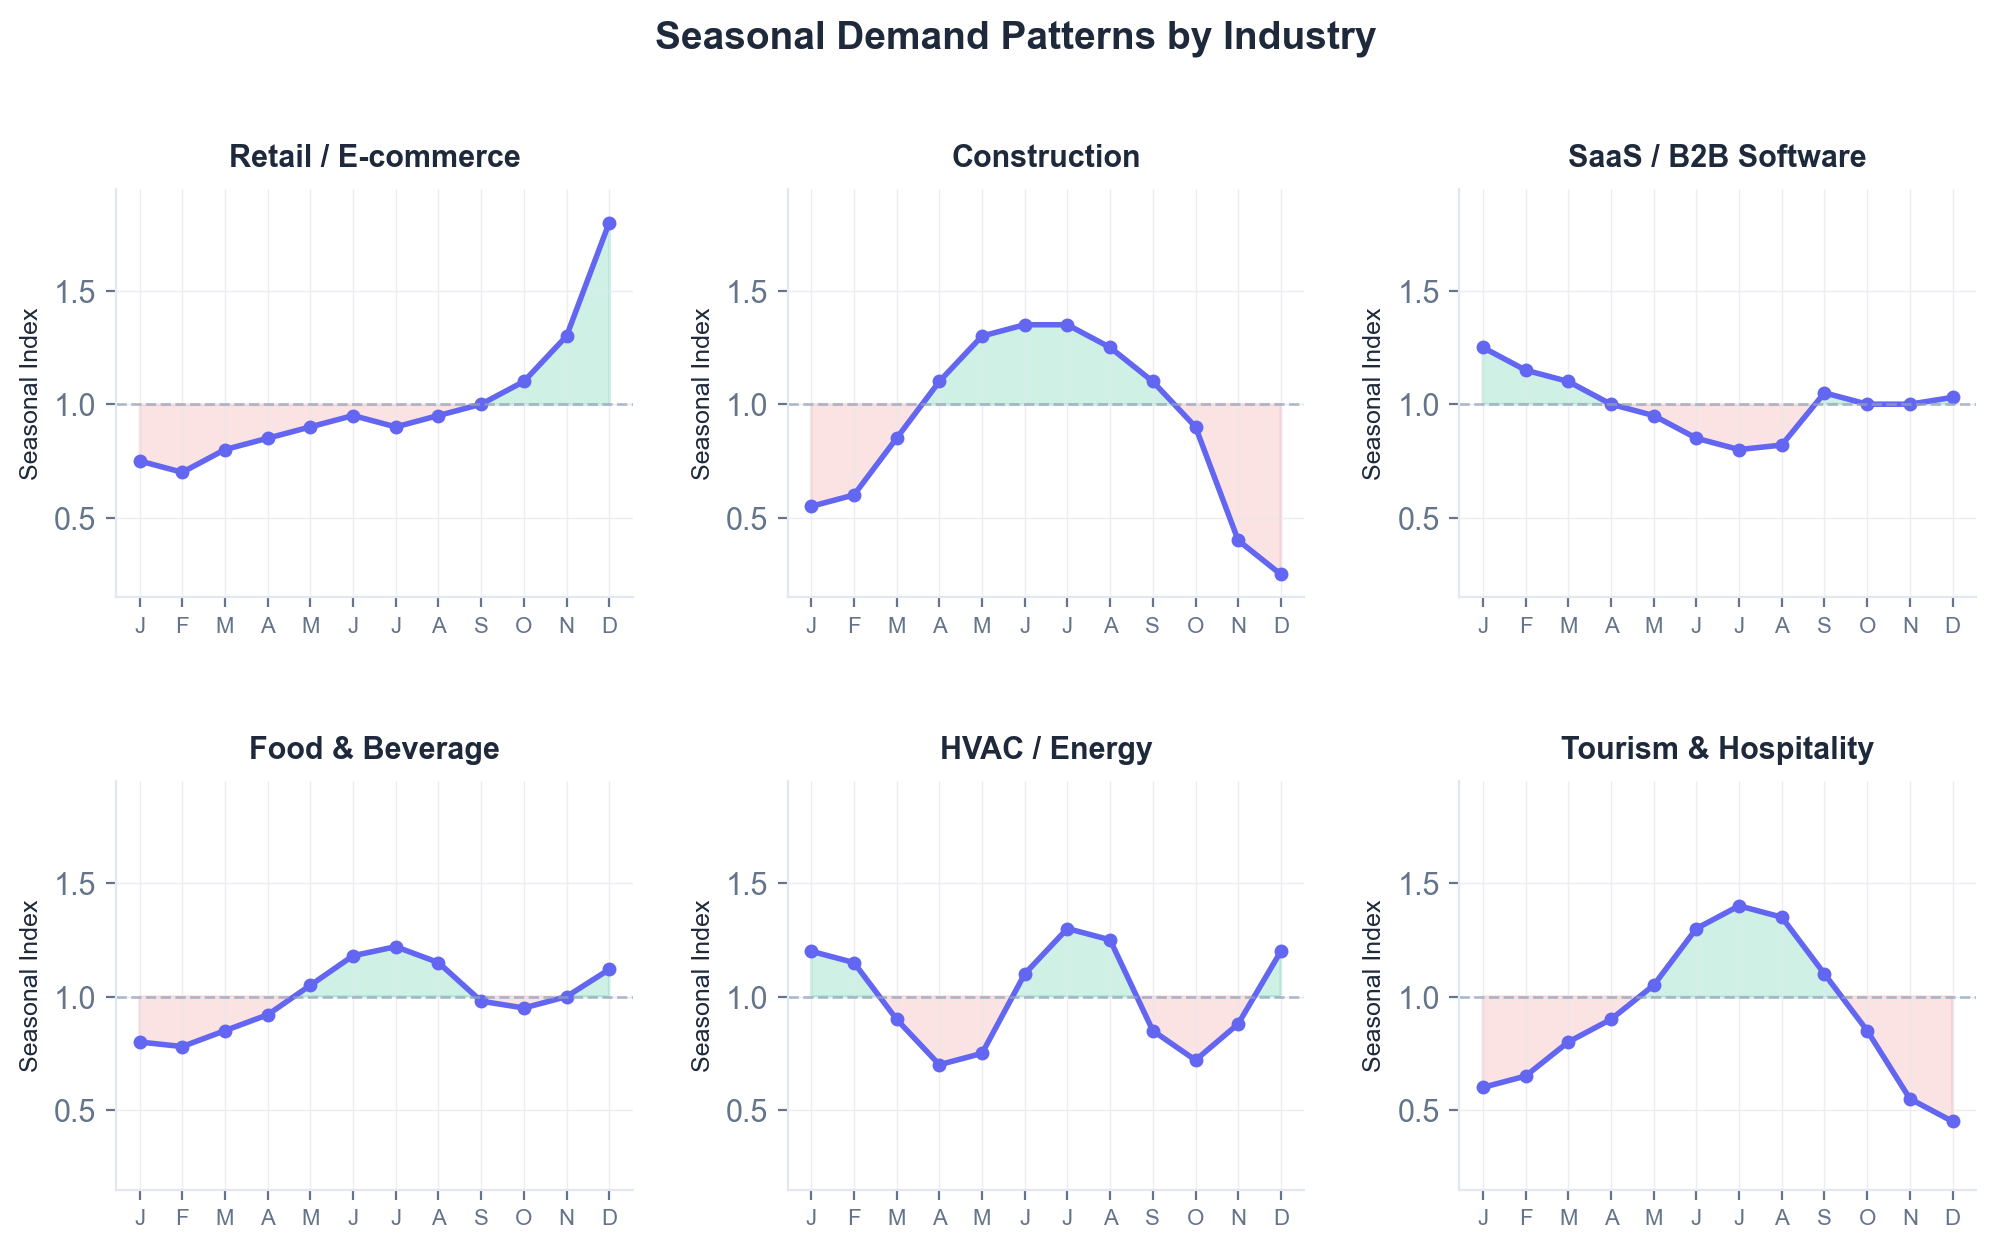
Seasonality looks different depending on your business. Understanding the typical pattern for your industry is a useful starting point — even before you analyze your own data.
| Industry | Peak Period | Low Period | Primary Driver |
|---|---|---|---|
| Retail / E-commerce | Nov–Dec | Jan–Feb | Holiday shopping, gift-giving |
| Construction | Apr–Sep | Dec–Feb | Weather, building conditions |
| SaaS / B2B Software | Jan–Mar, Sep | Jun–Aug | Budget cycles, fiscal year starts |
| Food & Beverage | Jun–Aug, Dec | Jan–Feb | Summer, holidays |
| HVAC / Energy | Jun–Aug, Dec–Feb | Apr, Oct | Temperature extremes |
| Tourism & Hospitality | Jun–Sep | Jan–Mar | School holidays, weather |
A few things to note. First, most businesses have more than one seasonal pattern at play — a primary cycle and secondary effects. Second, B2B seasonality is driven more by budget cycles and fiscal years than by weather or holidays. Third, your specific data might deviate from these industry norms. These are starting points, not substitutes for analyzing your own numbers.
How to Detect Seasonality in Your Data
You don't need statistics software to spot seasonality. Start with your eyes and a simple technique.
Visual Inspection: Year-over-Year Overlay
The fastest way to detect seasonality is to plot multiple years of monthly data on the same January–December axis. If you see the same shape repeating, you have seasonality.
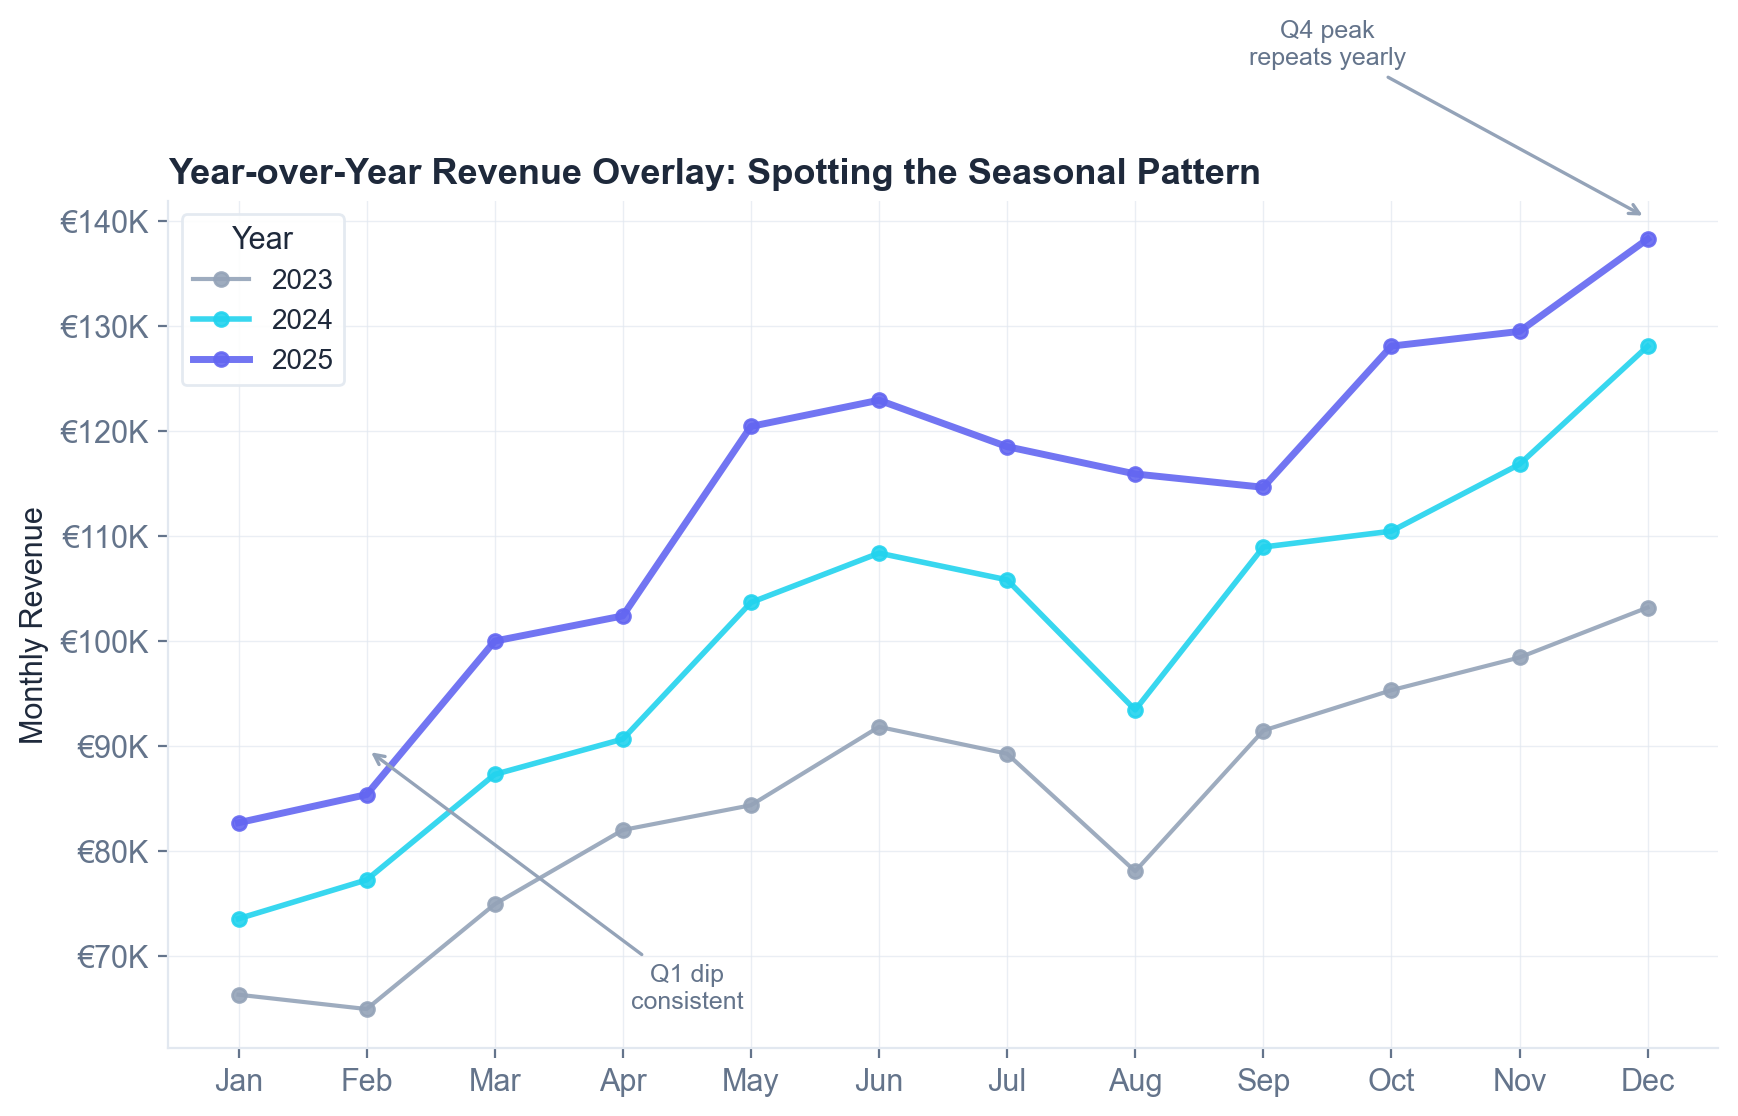
In the chart above, three years of monthly revenue are plotted on the same axis. The pattern is unmistakable: dips in Q1, a slow build through spring, a summer plateau, and a sharp Q4 spike. Year-over-year, the shape is consistent even though the level rises with the growth trend.
What you need: At least 2 full years of monthly data. Three years is better — it lets you distinguish a repeating pattern from a coincidence. If you have weekly data, even better for detecting short-cycle seasonality.
What If You Don't See a Pattern?
Not every business is seasonal, and that's fine. Some B2B services, recurring subscriptions, and commodity businesses have relatively flat demand across the year. If you plot the overlay and the lines cross randomly with no repeating shape, seasonality isn't your main forecasting challenge — trend and growth modeling will matter more.
Seasonal Indices: Quantifying the Pattern
Visual inspection tells you whether you have seasonality. Seasonal indices tell you how much.
A seasonal index measures each month's deviation from the average. An index of 1.0 means that month is exactly average. An index of 1.25 means 25% above average. An index of 0.80 means 20% below average.
How to Calculate Seasonal Indices
- Calculate total sales for each month across all available years
- Calculate the average monthly sales across all months and years (the grand average)
- Divide each month's average by the grand average
Worked example using three years of monthly data:
| Month | 3-Year Average | Grand Average | Seasonal Index |
|---|---|---|---|
| Jan | €72K | €100K | 0.72 |
| Feb | €78K | €100K | 0.78 |
| Mar | €88K | €100K | 0.88 |
| Apr | €95K | €100K | 0.95 |
| May | €102K | €100K | 1.02 |
| Jun | €108K | €100K | 1.08 |
| Jul | €105K | €100K | 1.05 |
| Aug | €98K | €100K | 0.98 |
| Sep | €104K | €100K | 1.04 |
| Oct | €110K | €100K | 1.10 |
| Nov | €118K | €100K | 1.18 |
| Dec | €122K | €100K | 1.22 |
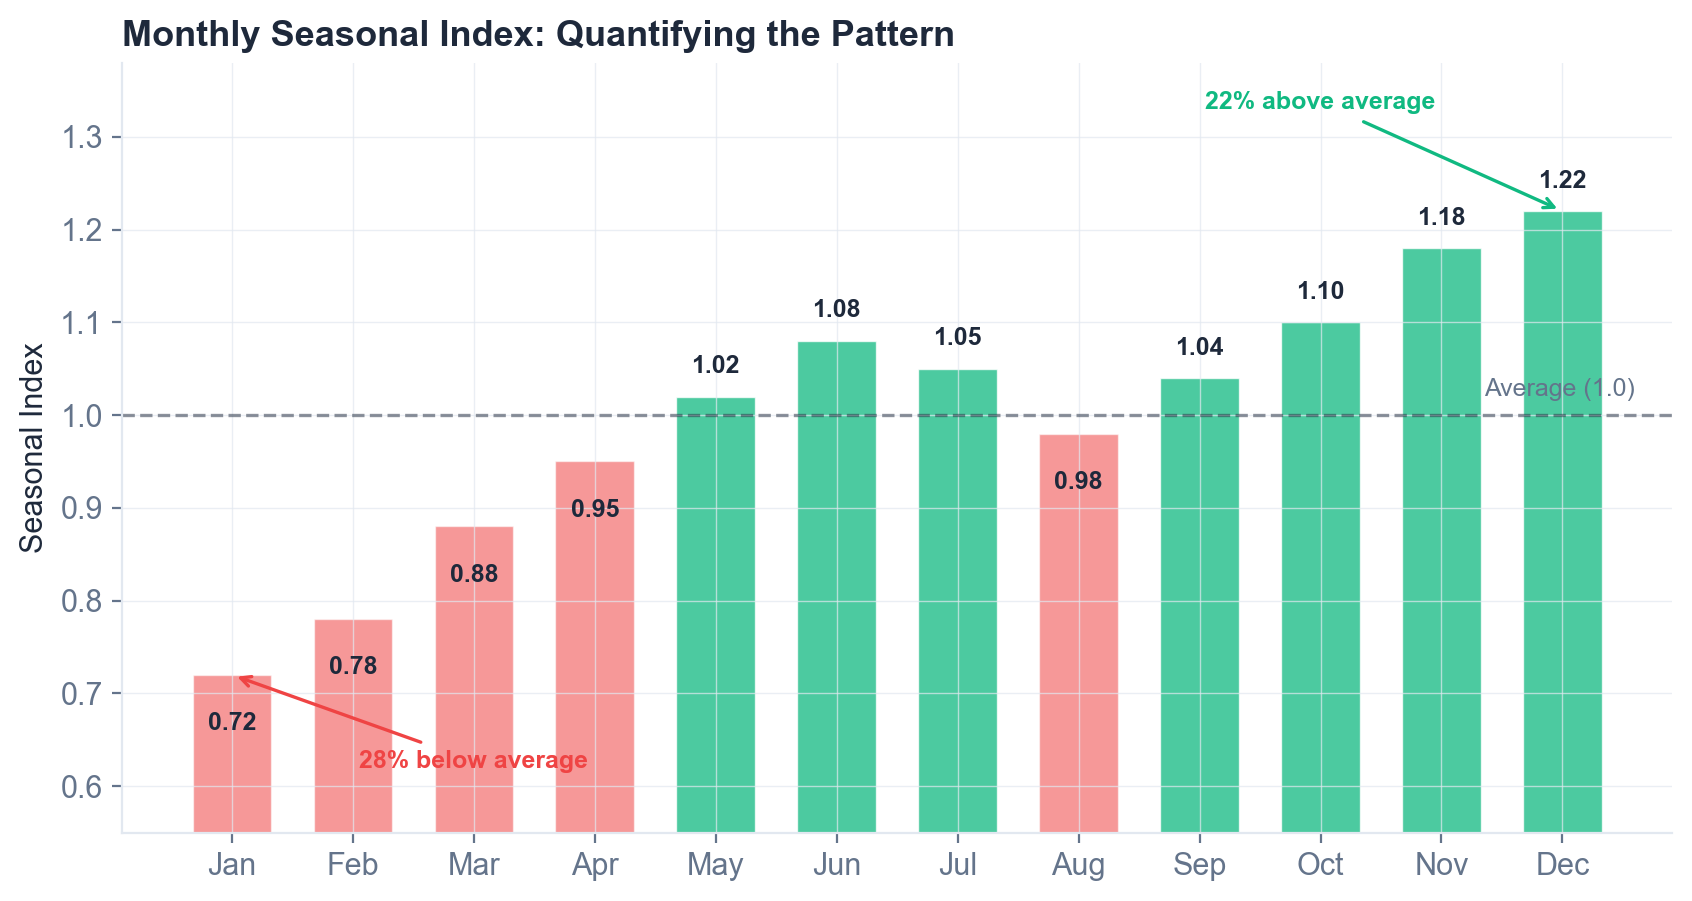
This tells you December is your strongest month (22% above average) and January is your weakest (28% below average). The indices should sum to approximately 12.0 (or average to 1.0) — if they don't, double-check your math.
Why indices instead of raw numbers? Because indices separate the shape of your seasonal pattern from the level of your sales. A business doing €50K/month and one doing €5M/month can have the same seasonal index profile. This makes the pattern reusable across years even as your business grows.
Building a Seasonal Sales Forecast (Step by Step)
With seasonal indices in hand, you can build a forecast that accounts for both your growth trajectory and your seasonal pattern. The process has three steps: deseasonalize, forecast the trend, and reseasonalize.
Step 1: Deseasonalize the Historical Data
Divide each month's actual sales by its seasonal index. This strips out the seasonal pattern and reveals the underlying trend.
If March actual sales = €176K and March seasonal index = 0.88: Deseasonalized March = €176K ÷ 0.88 = €200K
Do this for every month in your history. The resulting series should be smoother — showing just the trend without seasonal waves.
Step 2: Forecast the Trend
With the deseasonalized series, apply your preferred trend forecasting method. This could be a simple linear trend, a growth rate projection, or a more sophisticated model. The point is you're forecasting a smooth trend line, not trying to predict seasonal bumps.
For example, if deseasonalized sales are trending upward at roughly €5K/month, extend that line forward 12 months.
Step 3: Reseasonalize the Forecast
Multiply each month's trend forecast by the corresponding seasonal index to layer the seasonal pattern back on.
If the trend forecast for next December = €230K and December's seasonal index = 1.22: Seasonalized forecast = €230K × 1.22 = €280.6K
The result is a forecast that captures both where your business is going (trend) and when demand will be higher or lower (seasonality).
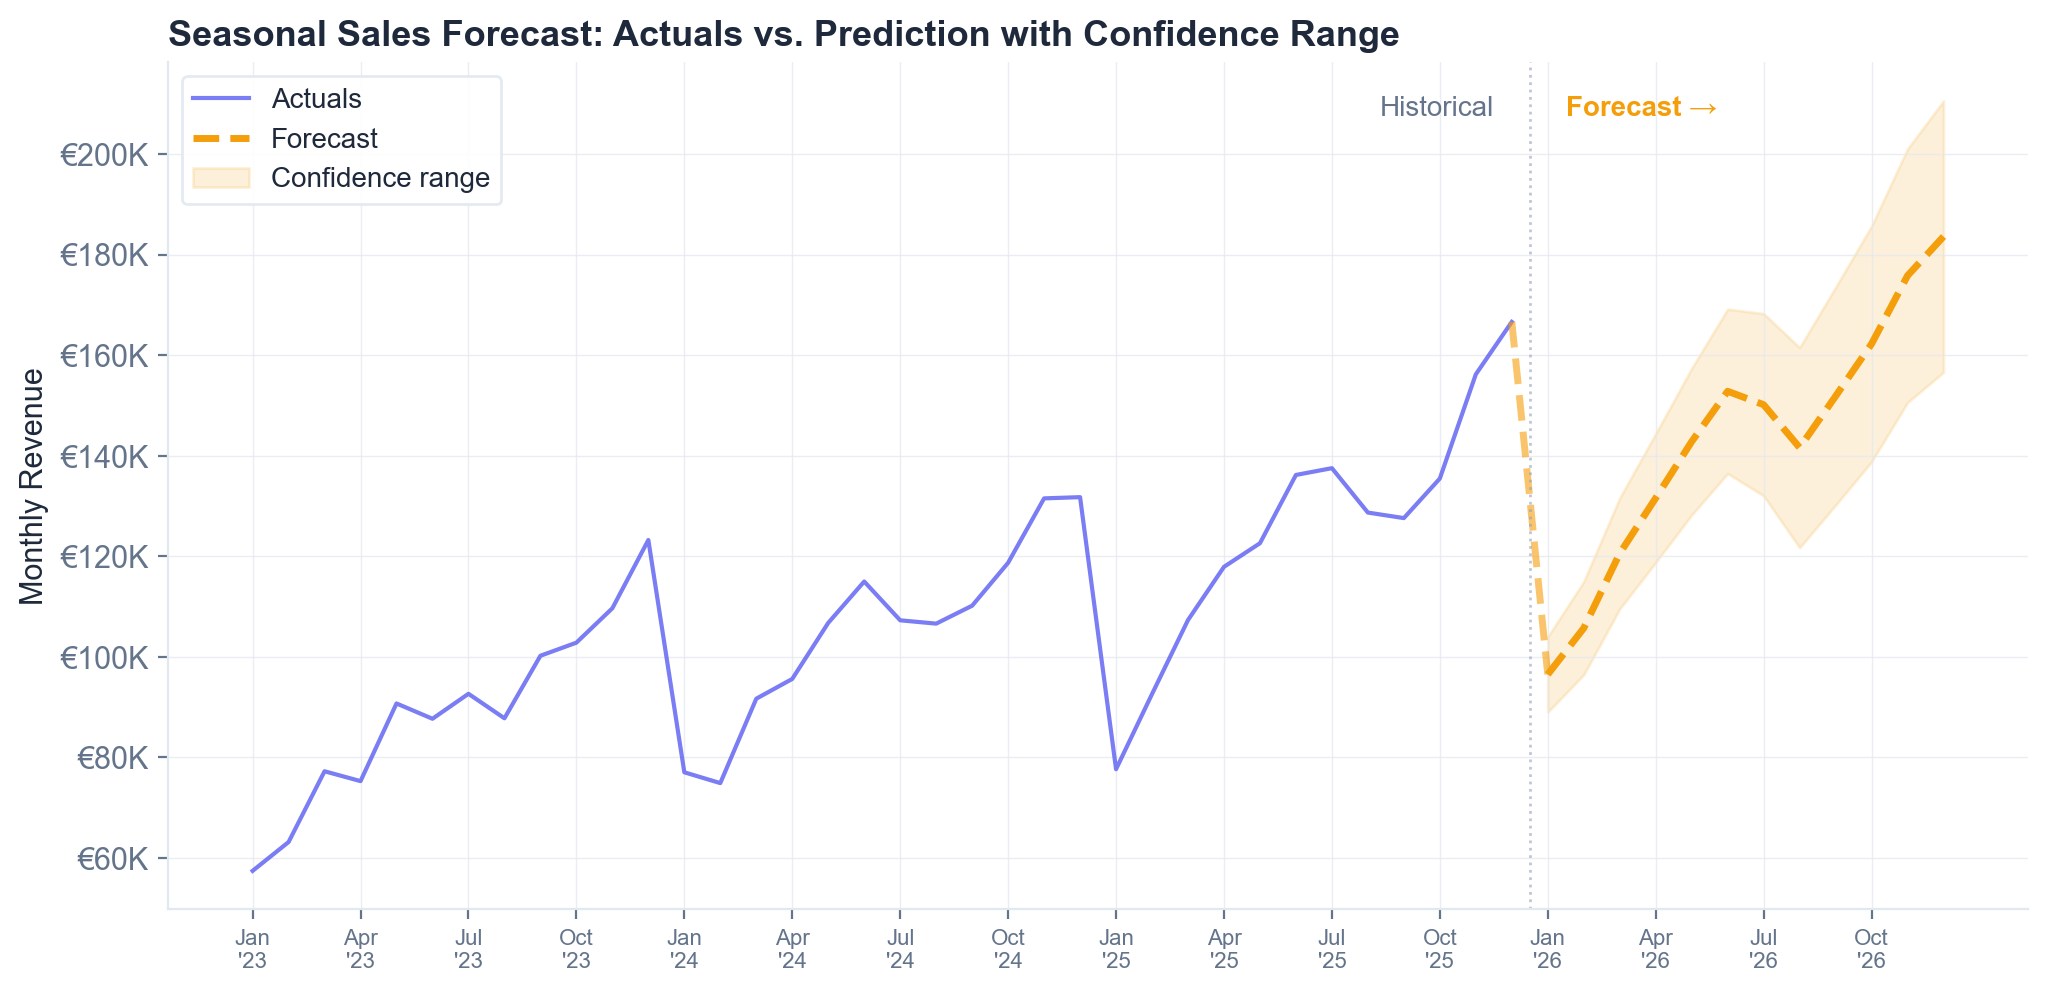
The chart above shows this approach applied to real data: historical actuals, a 12-month forecast, and a confidence band showing the range of likely outcomes. Notice how the forecast maintains the seasonal shape while projecting the upward trend forward.
Common Mistakes in Seasonal Forecasting
Seasonal forecasting is straightforward in theory. In practice, a few common mistakes can quietly undermine your projections.
Using annual averages instead of monthly data. If you forecast "€1.2M next year" without monthly breakdown, you're implicitly assuming flat demand across all 12 months. That €1.2M might mean €70K in January and €150K in December — a difference that matters enormously for staffing, inventory, and cash flow.
Confusing growth with seasonality. If this December was 30% higher than last December, is that seasonality or growth? Probably both. Failing to separate trend from seasonality leads to overestimating future peaks and underestimating future troughs.
Overfitting to an anomalous year. One unusual year — whether it's a pandemic, a supply chain disruption, or an unexpected viral moment — can distort your seasonal indices badly if you only have 2-3 years of data. Weight recent normal years more heavily, or exclude clear anomalies. For practical guidance on handling data quality issues, see our data cleaning guide.
Assuming the pattern never changes. Seasonal patterns can shift. Consumer behavior evolves, industries change, and external factors like climate or regulation can alter timing. Recalculate your seasonal indices annually with fresh data rather than relying on indices you calculated three years ago.
Ignoring sub-seasonal patterns. Monthly indices miss weekly and daily patterns — Black Friday within November, end-of-quarter rushes within March, payday spikes within any month. If your business has significant within-month variation, monthly indices won't capture it.
How External Factors Interact with Seasonality
Seasonality doesn't exist in a vacuum. External forces can amplify, dampen, or shift your seasonal patterns.
Weather is the most obvious factor for physical businesses. An unusually warm winter dampens HVAC and heating demand. A cool summer reduces ice cream and tourism spending. Weather doesn't eliminate the seasonal pattern, but it introduces year-to-year variation within it.
Economic conditions affect the amplitude of seasonal swings. In a recession, your holiday spike might still happen but at a lower magnitude. Consumer confidence, employment rates, and disposable income all modulate how pronounced the seasonal pattern is in any given year.
Calendar effects shift timing. Easter moves between March and April. Chinese New Year shifts by weeks each year. If your business is affected by these floating holidays, fixed monthly indices will be slightly off in any given year.
Marketing and promotion timing can reinforce or counteract natural seasonality. A Prime Day in July was Amazon's deliberate attempt to create a seasonal peak where none existed. Your own promotional calendar interacts with — and sometimes distorts — your underlying seasonal pattern.
The best seasonal forecasts account for these factors, either through manual adjustments or by incorporating external indicators into the model. For more on how economic data improves forecasting, see our guide on forecast accuracy.
Preparing for Demand Swings: The Operational Playbook
A seasonal forecast is only valuable if it drives better decisions. Here's how to translate your predictions into operational plans.
Inventory and Supply Chain
For product businesses, this is where seasonal forecasting pays for itself. Use your forecast to set safety stock levels and reorder points month by month — not at a flat annual level. Pre-position inventory 4-6 weeks before your predicted peak. Negotiate supplier agreements that align with your seasonal calendar.
Staffing and Workforce
Map your seasonal index to your staffing needs. If December demand is 22% above average, you likely need temporary staff, overtime authorization, or contractor support arranged by October. Conversely, plan training, maintenance, and strategic projects for your known slow months — use the troughs productively rather than just enduring them.
Marketing Calendar
Align marketing spend with your seasonal curve, but lead it by 2-4 weeks. If your peak begins in October, ramp marketing in September. Consider counter-seasonal campaigns during troughs to smooth demand — off-season promotions, early-bird pricing, or loyalty programs that reward year-round purchasing.
Cash Flow
Seasonal revenue means seasonal cash flow. Your biggest collection months might be followed by your leanest. Build a monthly cash flow forecast (not just a P&L) that reflects the seasonal timing of both revenue and expenses. Arrange credit lines before you need them, not during the trough.
For a deeper dive into how forecasts cascade into budgets, payroll, and working capital decisions, see our guide on scenario planning.
Key Takeaways
Seasonality is the most predictable pattern in most businesses' sales data, and yet it's routinely ignored in forecasts and planning. It doesn't require advanced modeling to get right. With 2-3 years of monthly data, seasonal indices, and a simple decomposition approach, you can build forecasts that are meaningfully more accurate than flat-line projections — and translate those forecasts into staffing, inventory, marketing, and cash flow plans that actually prepare your business for what's coming.
The biggest wins come not from predicting the peak itself (you already know when it is) but from quantifying it precisely enough to act on it. Knowing December is busy is intuition. Knowing December runs 22% above average with a ±8% confidence range — that's a forecast you can staff to, stock to, and budget to.
Want seasonal patterns detected automatically? Try Sanvia free for 14 days — our ML models decompose seasonality, trend, and external factors to produce forecasts you can act on immediately.
Related Articles
- How to Improve Sales Forecast Accuracy: 8 Proven Techniques
- Scenario Planning: How Sales Forecasts Drive Payroll, Budgets, and Cash Flow
- Inventory Planning 101: Safety Stock, Reorder Points & Why Forecasting Matters
- How to Forecast Sales in Excel (Free Template Included)
- Data Cleaning for Sales Forecasting: A Practical Guide