How to Write a 5-Year Business Plan (Free Template Included)
A 5-year business plan is the document that turns "I have an idea" into "here's exactly how we'll build a €10M business." Banks require it for loans. Investors expect it for funding. And even if you're bootstrapping, the exercise forces clarity that pays dividends for years.
But most 5-year plans are fiction. They project hockey-stick growth with no grounding in reality, list milestones that sound impressive but mean nothing, and fall apart the moment someone asks "how did you get these numbers?"
This guide shows you how to build a plan that survives scrutiny—starting with the financial projections that make or break credibility.
Download the free template: 5-Year Business Plan Template (Excel)
Why 5 Years?
Five years is the standard for a reason:
- Long enough to show meaningful growth and return on investment
- Short enough to make credible projections (anything beyond 5 years is pure speculation)
- Expected by banks, investors, and grant programs
For SBA loans in the US, bank financing in Europe, or any institutional funding, a 5-year plan isn't optional—it's table stakes.
That said, not all years are created equal. Years 1-2 need real forecasting rigor. Years 3-5 are directional—showing where you're headed, not predicting exact numbers. Sophisticated readers know this. They'll scrutinize your Year 1 assumptions while treating Year 5 as aspirational.
The 7 Essential Sections
A complete 5-year business plan includes:
- Executive Summary
- Business Description
- Market Analysis
- Sales & Marketing Strategy
- Operations Plan
- Financial Projections
- Milestones & Risk Factors
Let's break down each one.
1. Executive Summary
Write this last. It's a one-page overview of everything that follows—your business in miniature.
Include:
- What you do (one sentence)
- The problem you solve
- Your target market
- Business model (how you make money)
- Current traction (revenue, customers, growth rate)
- Funding request (if applicable)
- Key financial highlights (Year 1 revenue, Year 5 revenue, break-even point)
Keep it under 500 words. If someone reads only this page, they should understand your business completely.
2. Business Description
Explain what your business actually does. This sounds obvious, but vague descriptions kill credibility.
Cover:
- Mission statement: Why you exist (one sentence)
- Products/services: What you sell, at what price points
- Business model: Subscription? One-time purchase? Service fees?
- Legal structure: LLC, corporation, sole proprietorship
- Location: Where you operate, remote vs. physical
- History: When founded, key milestones to date
Be specific. "We help people live sustainably" means nothing. "We sell eco-friendly home products online—reusable kitchenware, organic bedding, and plastic-free cleaning supplies—with an average order value of €65" tells readers exactly what you do.
3. Market Analysis
Prove there's a market worth pursuing and that you understand it.
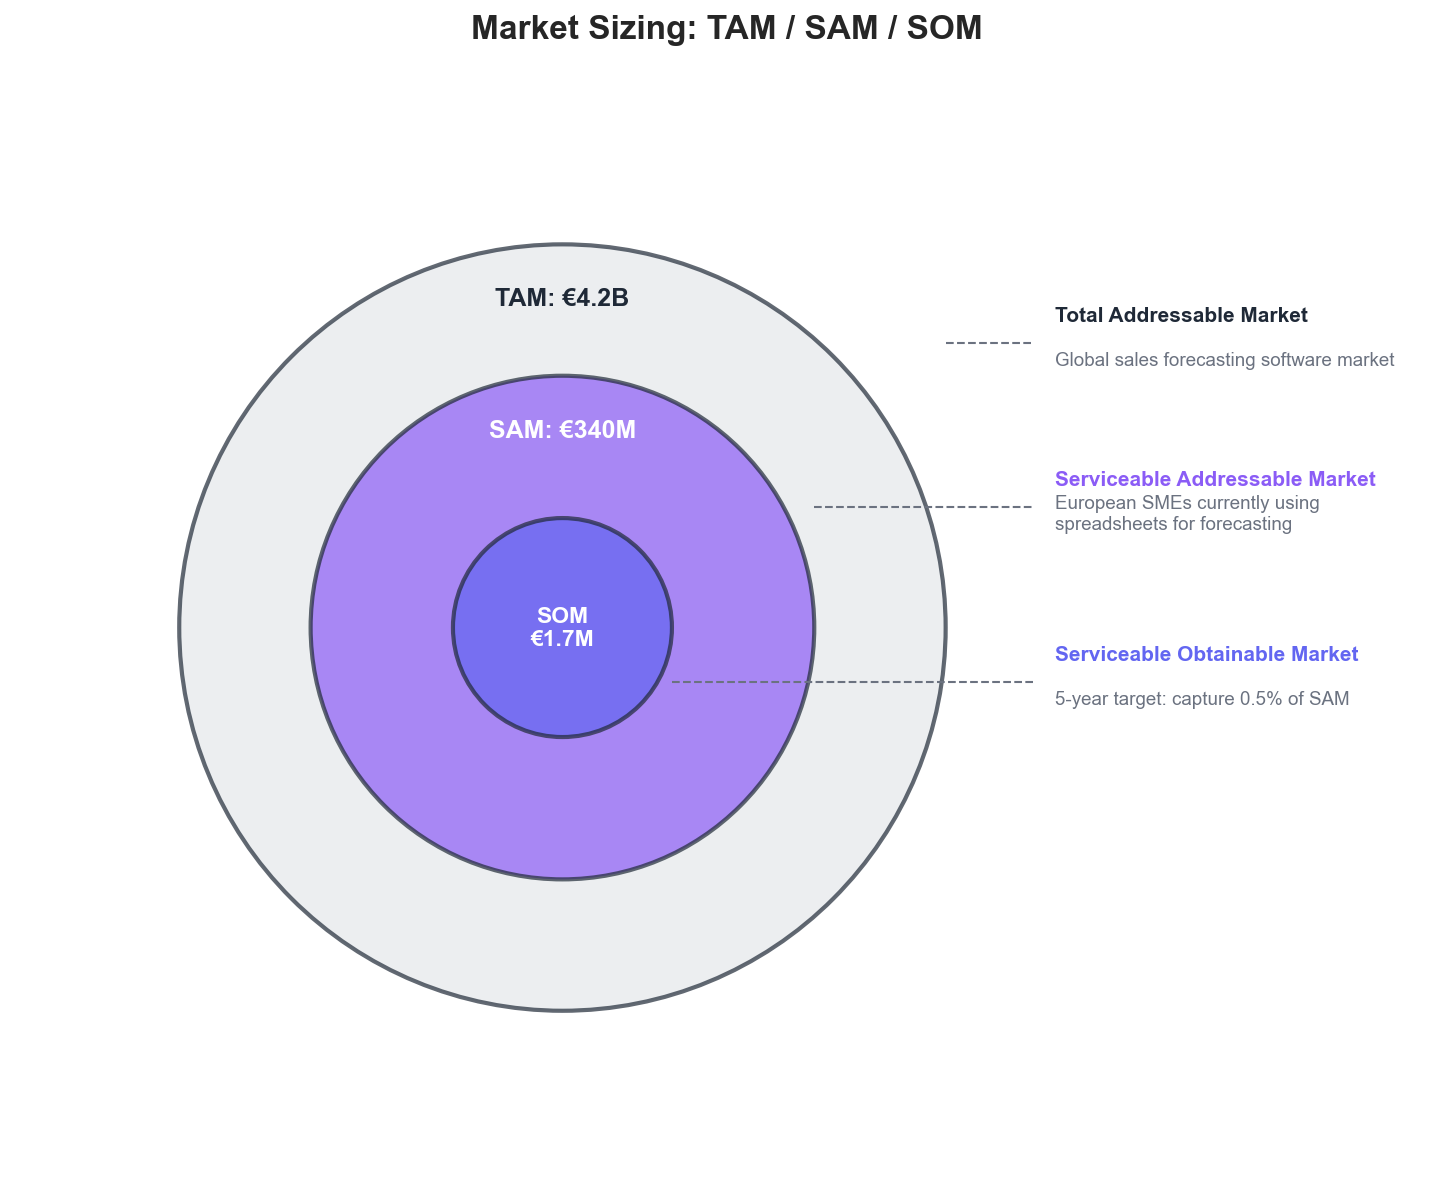
Market Sizing (TAM/SAM/SOM)
- TAM (Total Addressable Market): The entire market if you had 100% share. "The global sustainable home goods market is €38B."
- SAM (Serviceable Addressable Market): The portion you could realistically serve. "Online eco-conscious shoppers in Western Europe represent €4.2B."
- SOM (Serviceable Obtainable Market): What you can capture in 5 years. "We target 0.02% of SAM = €840K revenue by Year 5."
Competitive Landscape
List 3-5 competitors and your differentiation:
| Competitor | Strength | Weakness | Your Advantage |
|---|---|---|---|
| Amazon (eco section) | Massive reach, convenience | No curation, greenwashing concerns | Curated, verified sustainable |
| Big-box retailers | Physical presence, price | Limited eco range, less authentic | Specialist expertise, community |
| Other eco e-commerce | Sustainable focus | Narrow product range, higher prices | Broader selection, competitive pricing |
Market Trends
What tailwinds support your business?
- Growing adoption of AI/ML in SMEs
- Shift from spreadsheets to SaaS tools
- Increasing demand for data-driven decision making
4. Sales & Marketing Strategy
How will you acquire customers? This section needs to be concrete, not aspirational.
Target Customer Profile
Define your ideal customer precisely:
- Industry: Wholesale distribution, building materials, HVAC
- Size: €1M-50M annual revenue, 10-200 employees
- Role: Finance manager, operations director, business owner
- Pain point: Spending hours on Excel forecasts that are still inaccurate
Acquisition Channels
| Channel | Strategy | CAC Target | Timeline |
|---|---|---|---|
| Content marketing | SEO-optimized guides, templates | €50 | Month 6+ |
| Cold outreach | Personalized forecast reports | €150 | Month 1+ |
| Partnerships | Accountants, ERP consultants | €100 | Month 3+ |
| Paid ads | LinkedIn, Google (later stage) | €200 | Month 12+ |
Pricing Strategy
Explain your pricing logic:
- Starter (€79/mo): Small businesses, single user
- Professional (€149/mo): Growing businesses, team features
- Enterprise (€249/mo): Larger SMEs, API access, priority support
5. Operations Plan
How does the business actually run?
Team Structure
Current team and planned hires:
| Role | Year 1 | Year 2 | Year 3 | Year 5 |
|---|---|---|---|---|
| Founders | 2 | 2 | 2 | 2 |
| Engineering | 0 | 1 | 2 | 4 |
| Sales/Marketing | 0 | 1 | 2 | 3 |
| Support | 0 | 0 | 1 | 2 |
| Total | 2 | 4 | 7 | 11 |
Technology & Infrastructure
- Hosting: AWS/GCP (scales with usage)
- Tech stack: [Your stack]
- Key tools: [CRM, analytics, etc.]
Key Processes
- Customer onboarding: Self-serve with optional demo
- Support: Email + chat, <4 hour response time
- Development: 2-week sprints, continuous deployment
6. Financial Projections
This is where plans succeed or fail. Investors and banks will spend 80% of their analysis time here.
The Golden Rule: Year 1 Must Be Defensible
Your 5-year plan is a story. Your Year 1 forecast is the proof.
Anyone can project €5M in Year 5. The question is whether your Year 1 numbers are grounded in reality. If Year 1 falls apart under scrutiny, nothing else matters.
Year 1 projections need:
- Monthly granularity (not annual)
- Bottom-up calculations (not "we'll capture X% of the market")
- Realistic ramp times (month 1 ≠ month 12)
- Seasonality if relevant
Bottom-Up vs. Top-Down
Top-down (weak):
"The market is €4B. If we get just 0.1%, that's €4M revenue."
This tells investors nothing about how you'll get there.
Bottom-up (strong):
"We'll acquire 10 customers in Q1, 25 in Q2, 50 in Q3, 80 in Q4 at €150 average MRR. That's €2,475 MRR by December, €19,800 ARR exiting Year 1."
This shows you've thought through the mechanics.
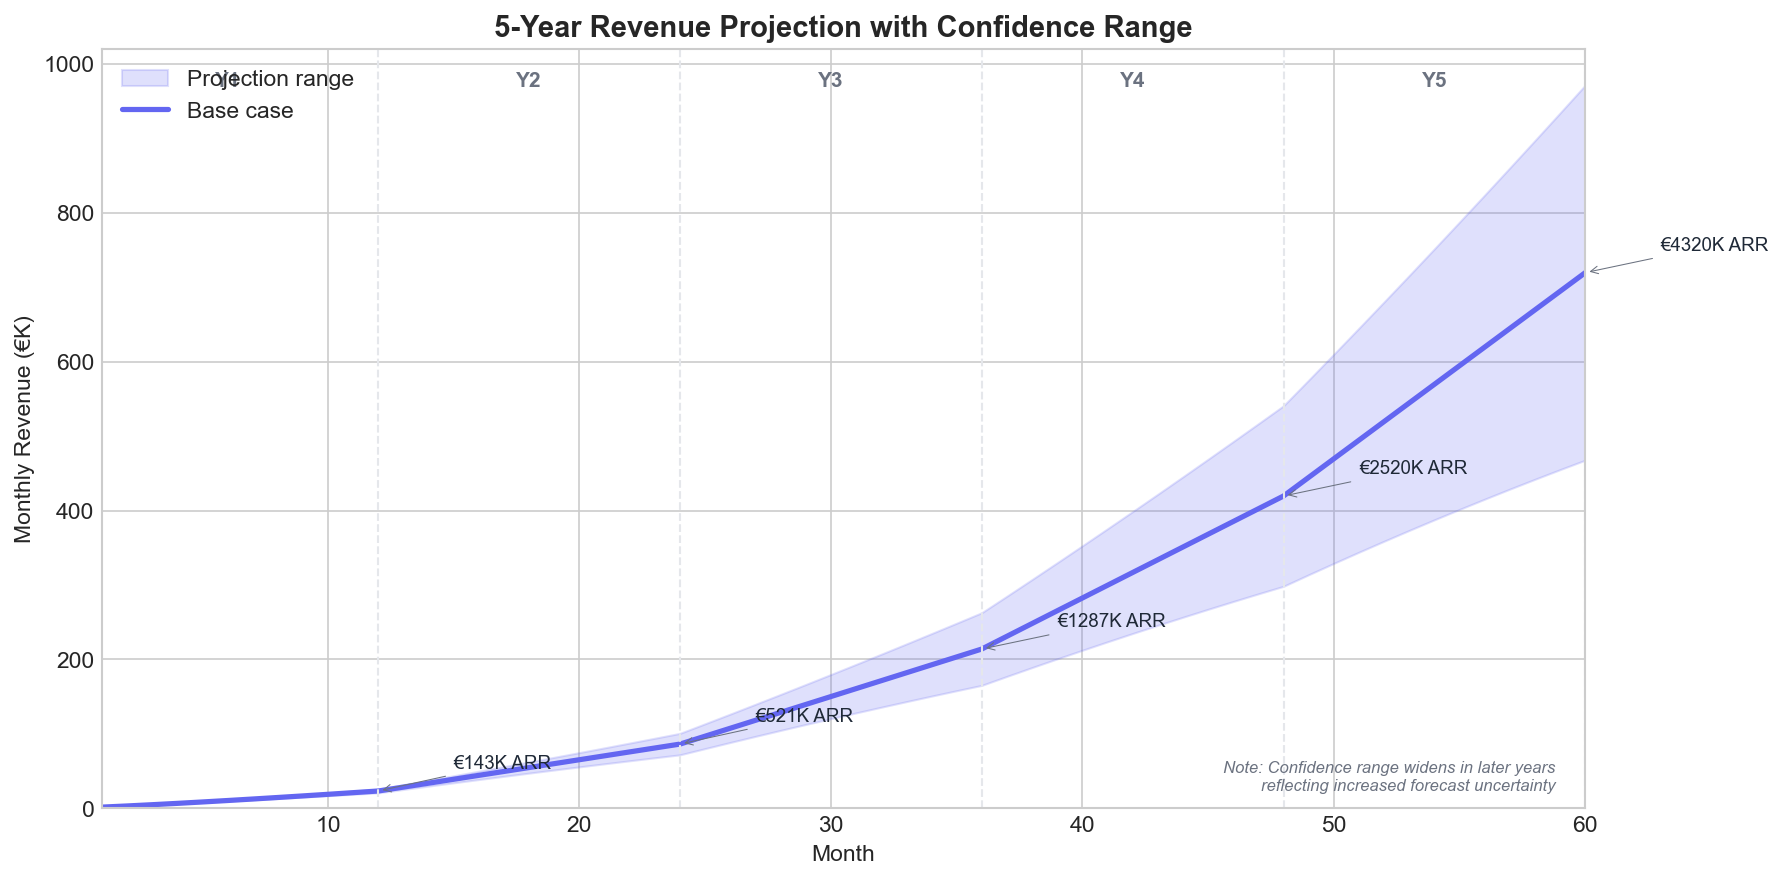
Revenue Projections
| Metric | Year 1 | Year 2 | Year 3 | Year 4 | Year 5 |
|---|---|---|---|---|---|
| Customers (end of year) | 85 | 280 | 650 | 1,200 | 2,000 |
| Average MRR | €140 | €155 | €165 | €175 | €180 |
| ARR | €143K | €521K | €1.29M | €2.52M | €4.32M |
| Growth Rate | — | 264% | 147% | 95% | 71% |
Note how growth rates decline over time. This is realistic. Projecting 100%+ growth in Year 5 destroys credibility.
The Forecast Error Problem
Here's what most plans ignore: forecast error compounds.
If your Year 1 projection is off by 15%, your Year 5 projection isn't off by 15%—it's off by 50-80%.
| Scenario | Y1 Error | Y5 Cumulative Error |
|---|---|---|
| Optimistic bias | +15% | +67% |
| Pessimistic bias | -15% | -56% |
| Realistic range | ±10% | ±40% |
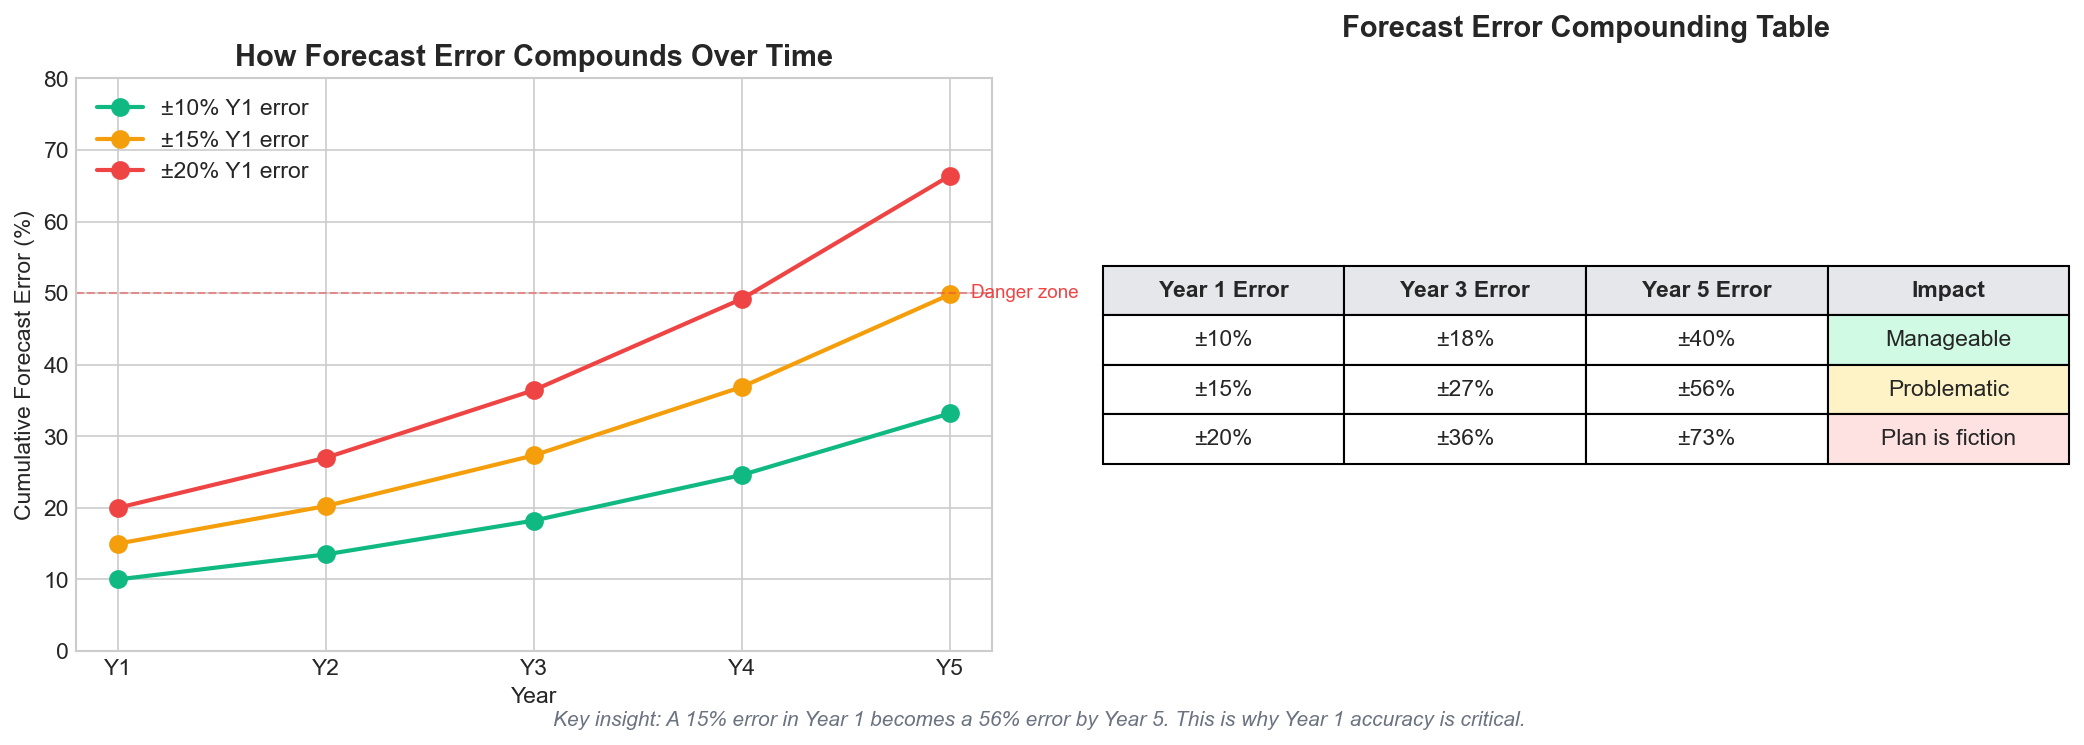
This is why Year 1 accuracy matters so much. Every downstream assumption—hiring, marketing spend, cash needs—inherits your forecast error.
What banks and investors look for:
- Realistic Year 1 assumptions they can verify
- Awareness of uncertainty (ranges, not false precision)
- Evidence you've used actual forecasting methods, not guesswork
Expense Budget
| Category | Year 1 | Year 2 | Year 3 | Year 4 | Year 5 |
|---|---|---|---|---|---|
| Salaries | €120K | €240K | €420K | €660K | €880K |
| Infrastructure | €12K | €24K | €48K | €84K | €120K |
| Marketing | €24K | €60K | €120K | €180K | €240K |
| Operations | €18K | €36K | €60K | €96K | €132K |
| Total Expenses | €174K | €360K | €648K | €1.02M | €1.37M |
Profitability
| Metric | Year 1 | Year 2 | Year 3 | Year 4 | Year 5 |
|---|---|---|---|---|---|
| Revenue | €143K | €521K | €1.29M | €2.52M | €4.32M |
| Expenses | €174K | €360K | €648K | €1.02M | €1.37M |
| Net Income | -€31K | €161K | €639K | €1.50M | €2.95M |
| Margin | -22% | 31% | 50% | 60% | 68% |
Cash Flow
Revenue ≠ cash. Model when money actually arrives:
- Payment terms (monthly subscription = immediate; enterprise = 30-60 days)
- Upfront costs (hiring, equipment) vs. recurring costs
- Seasonal variations
Calculate runway for each scenario:
- Best case: profitable by Month 14
- Base case: profitable by Month 20
- Worst case: need €80K additional funding by Month 18
Break-Even Analysis
When does revenue cover costs?
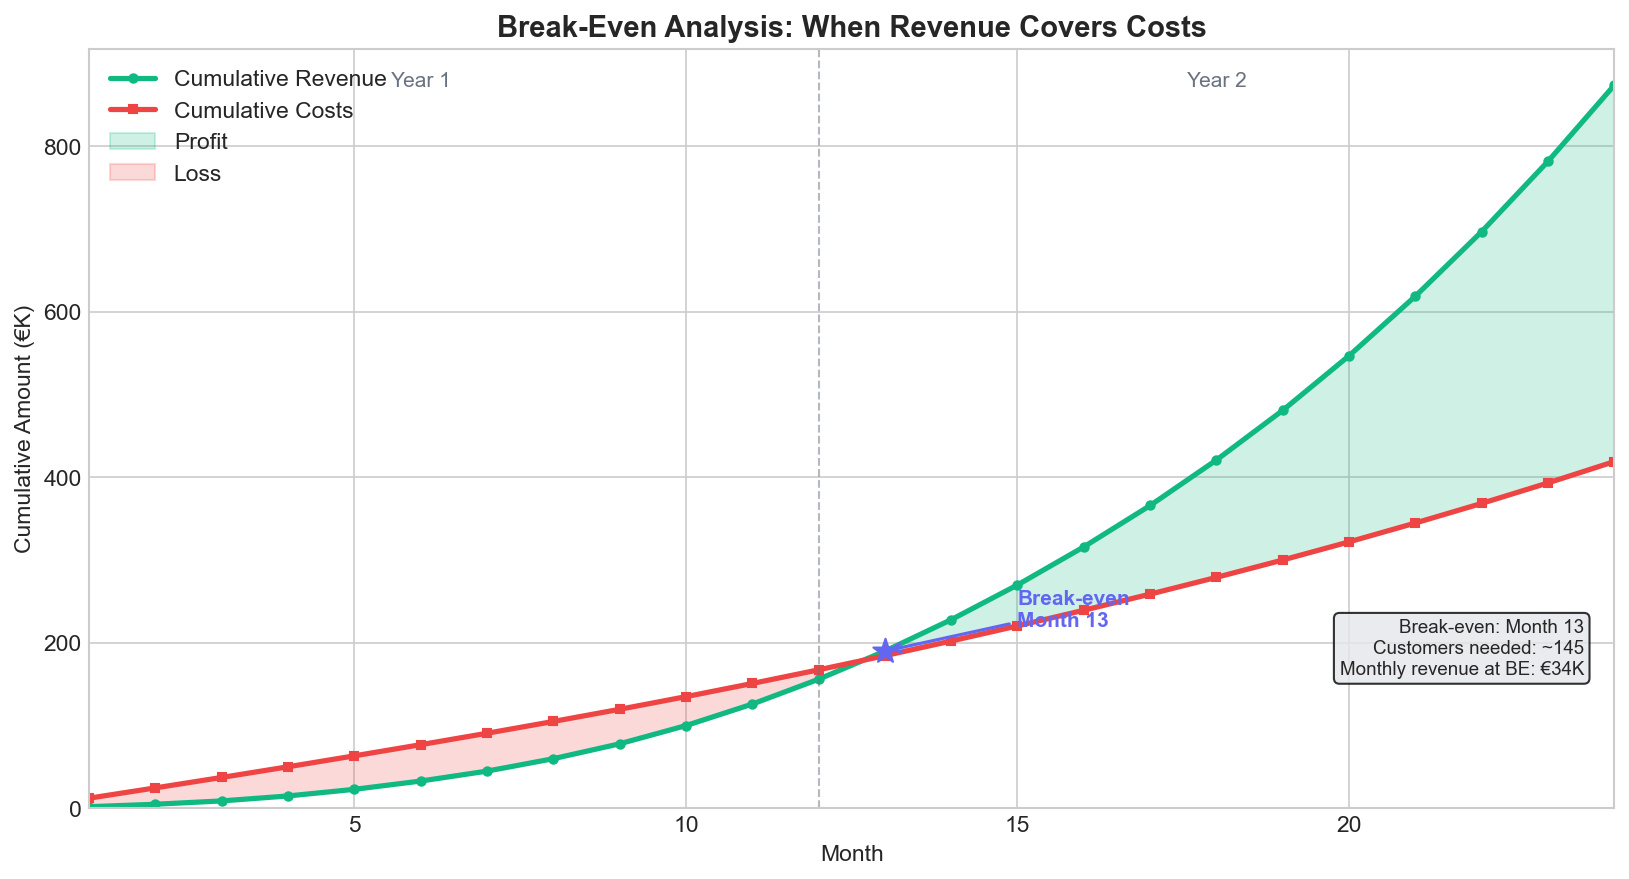
Break-even point: Month 16 at 145 customers
7. Milestones & Risk Factors
5-Year Milestone Timeline
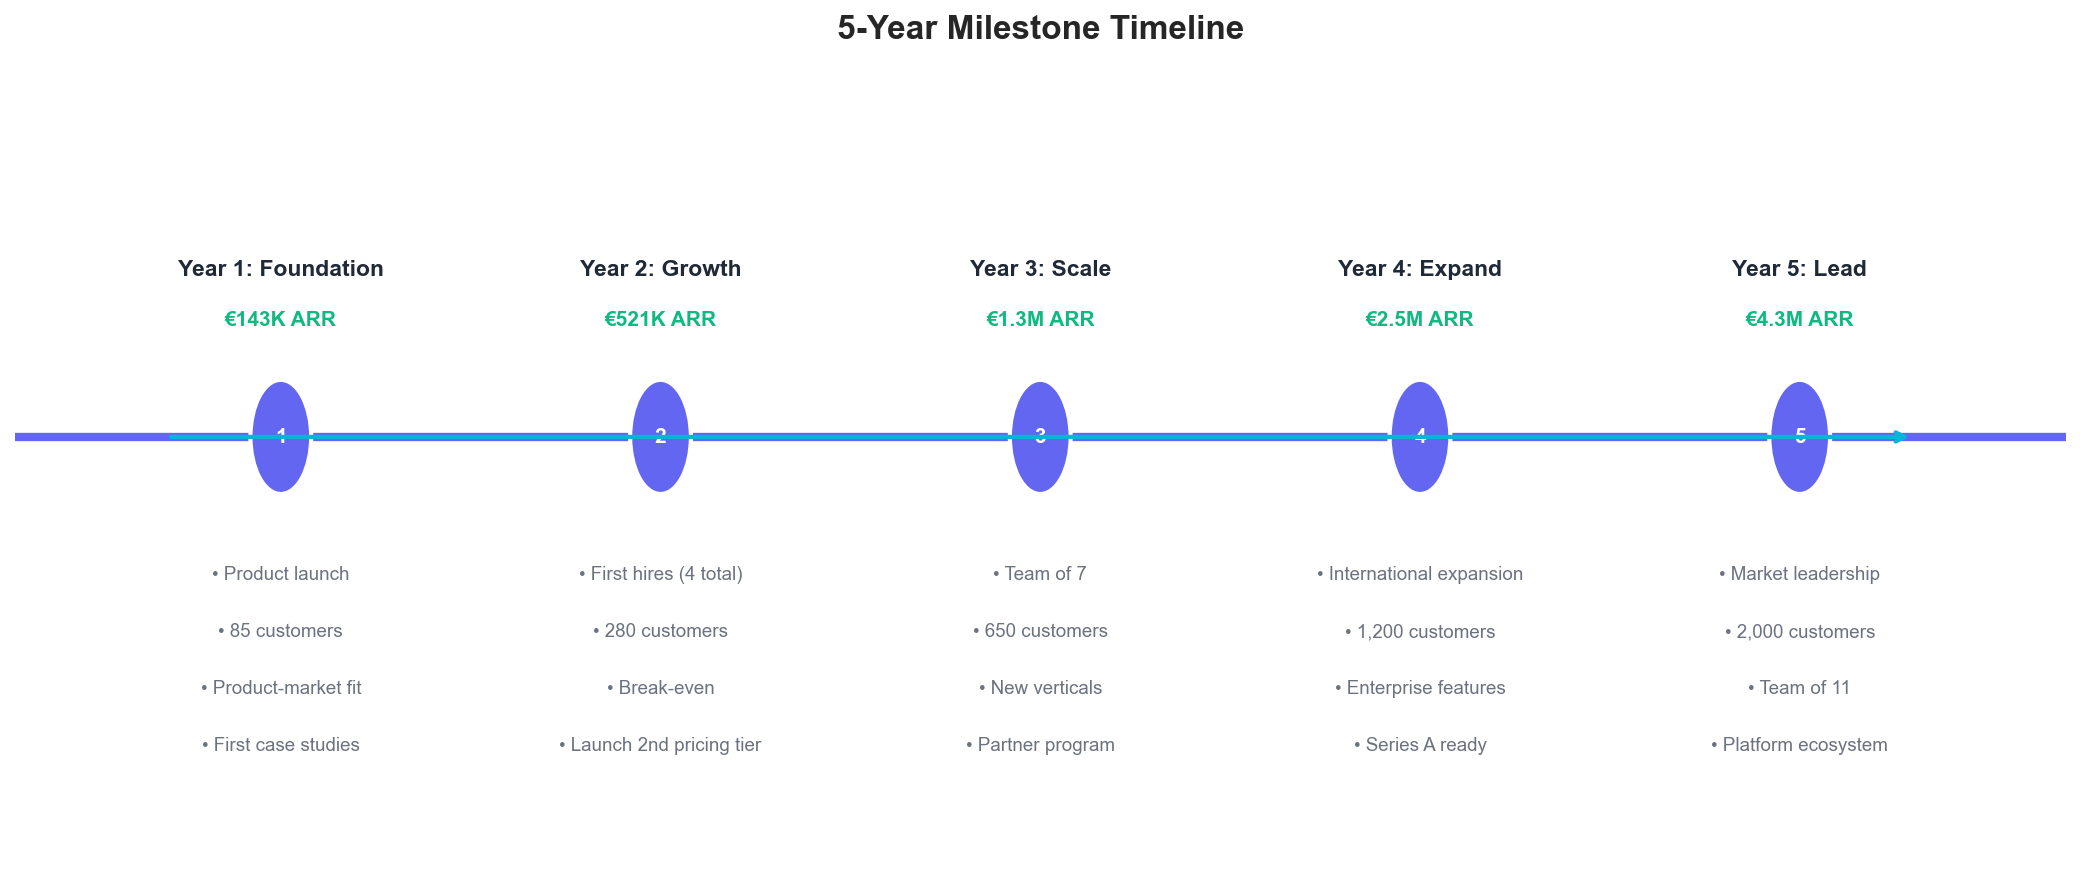
| Year | Revenue Target | Key Milestones |
|---|---|---|
| Year 1 | €143K ARR | Launch, 85 customers, product-market fit |
| Year 2 | €521K ARR | First hire, 280 customers, break-even |
| Year 3 | €1.29M ARR | Team of 7, expand to new verticals |
| Year 4 | €2.52M ARR | International expansion, enterprise features |
| Year 5 | €4.32M ARR | Market leadership in SME segment |
Risk Factors
Be honest about what could go wrong. Investors respect founders who acknowledge risk.
| Risk | Likelihood | Impact | Mitigation |
|---|---|---|---|
| Slower customer acquisition | Medium | High | Diversify channels, extend runway |
| Competitor enters with funding | Medium | Medium | Focus on niche, build switching costs |
| Economic downturn | Low-Medium | High | Target recession-resistant industries |
| Key person departure | Low | High | Document processes, equity vesting |
| Technology disruption | Low | Medium | Modular architecture, continuous R&D |
Making Your Financial Projections Credible
The difference between a plan that gets funded and one that gets rejected often comes down to the quality of your revenue forecast.
Red flags that kill credibility:
- "We'll grow 200% every year for 5 years"
- Round numbers everywhere (exactly €1M, €2M, €5M)
- No explanation of assumptions
- Ignoring seasonality
- Year 1 revenue starting at €0 in January, €100K by December with no explanation
Green flags that build trust:
- Monthly projections for Year 1 showing realistic ramp
- Bottom-up calculations (customers × price × churn)
- Growth rates that decline over time
- Scenario ranges (base, optimistic, pessimistic)
- External factors considered (market growth, economic conditions)
The Role of Proper Forecasting
Spreadsheet-based projections have an uncomfortable secret: they're usually wrong by 30-50%.
Why? They miss seasonality, ignore external factors, and bake in human biases (sales teams overestimate; finance teams sandbag).
Modern ML-based forecasting can cut that error in half by:
- Detecting patterns humans miss
- Incorporating external economic indicators
- Providing consistent, unbiased projections
- Automatically updating as new data arrives
Your 5-year plan will be revised. The question is whether you're revising from a solid Year 1 foundation or rebuilding from scratch because your initial projections were fiction.
Download the Free Template
We've built a complete 5-year business plan template in Excel that includes:
- ✅ Executive Summary (fill-in-the-blank)
- ✅ Revenue projection calculator (monthly Y1, quarterly Y2, annual Y3-5)
- ✅ Expense budget with categories
- ✅ Cash flow forecast
- ✅ Break-even calculator
- ✅ Milestone tracker
- ✅ Instructions for each section
Download: 5-Year Business Plan Template (Excel)
Next Steps
- Download the template and fill in your business details
- Build your Year 1 forecast with monthly granularity—this is the foundation everything else rests on
- Stress-test your assumptions—what happens if customer acquisition takes 2x longer?
- Get feedback from advisors, potential investors, or peers before finalizing
Your 5-year plan is a living document. Update it quarterly as you learn what's actually working.
Need accurate Year 1 projections that banks and investors trust? Try Sanvia free for 14 days—build ML-powered forecasts in minutes, not days.