You've run four forecasting models on your data. LightGBM says revenue will hit €57M next quarter. SARIMAX says €51M. Prophet says €59M. Theta-GAM says €62M.
Which one do you trust?
Here's a counterintuitive answer: trust all of them—by averaging their predictions into an ensemble forecast.
The Wisdom of the Crowd, Applied to Forecasting
In 1906, statistician Francis Galton observed something strange at a county fair. Nearly 800 people guessed the weight of an ox. Individual guesses were wildly off, but the average of all guesses was almost perfect—within 1% of the actual weight.
This "wisdom of the crowd" effect appears everywhere: prediction markets, jury decisions, and yes, forecasting models.
Different forecasting models make different assumptions about your data:
- LightGBM learns complex non-linear patterns through gradient boosting
- SARIMAX-Ridge models autoregressive relationships with regularization
- Prophet detects changepoints and handles seasonality flexibly
- Theta-GAM decomposes trends and applies exponential smoothing
When these models agree, you can be confident. When they disagree, the average often lands closer to the truth than any single prediction—because individual model errors tend to cancel out.
A Real Example: Quarterly Revenue Forecasting
Let's look at actual quarterly revenue data spanning 30+ years. We trained all four models and generated forecasts for 12 quarters (2022-Q1 through 2024-Q4), then compared predictions against actual results.
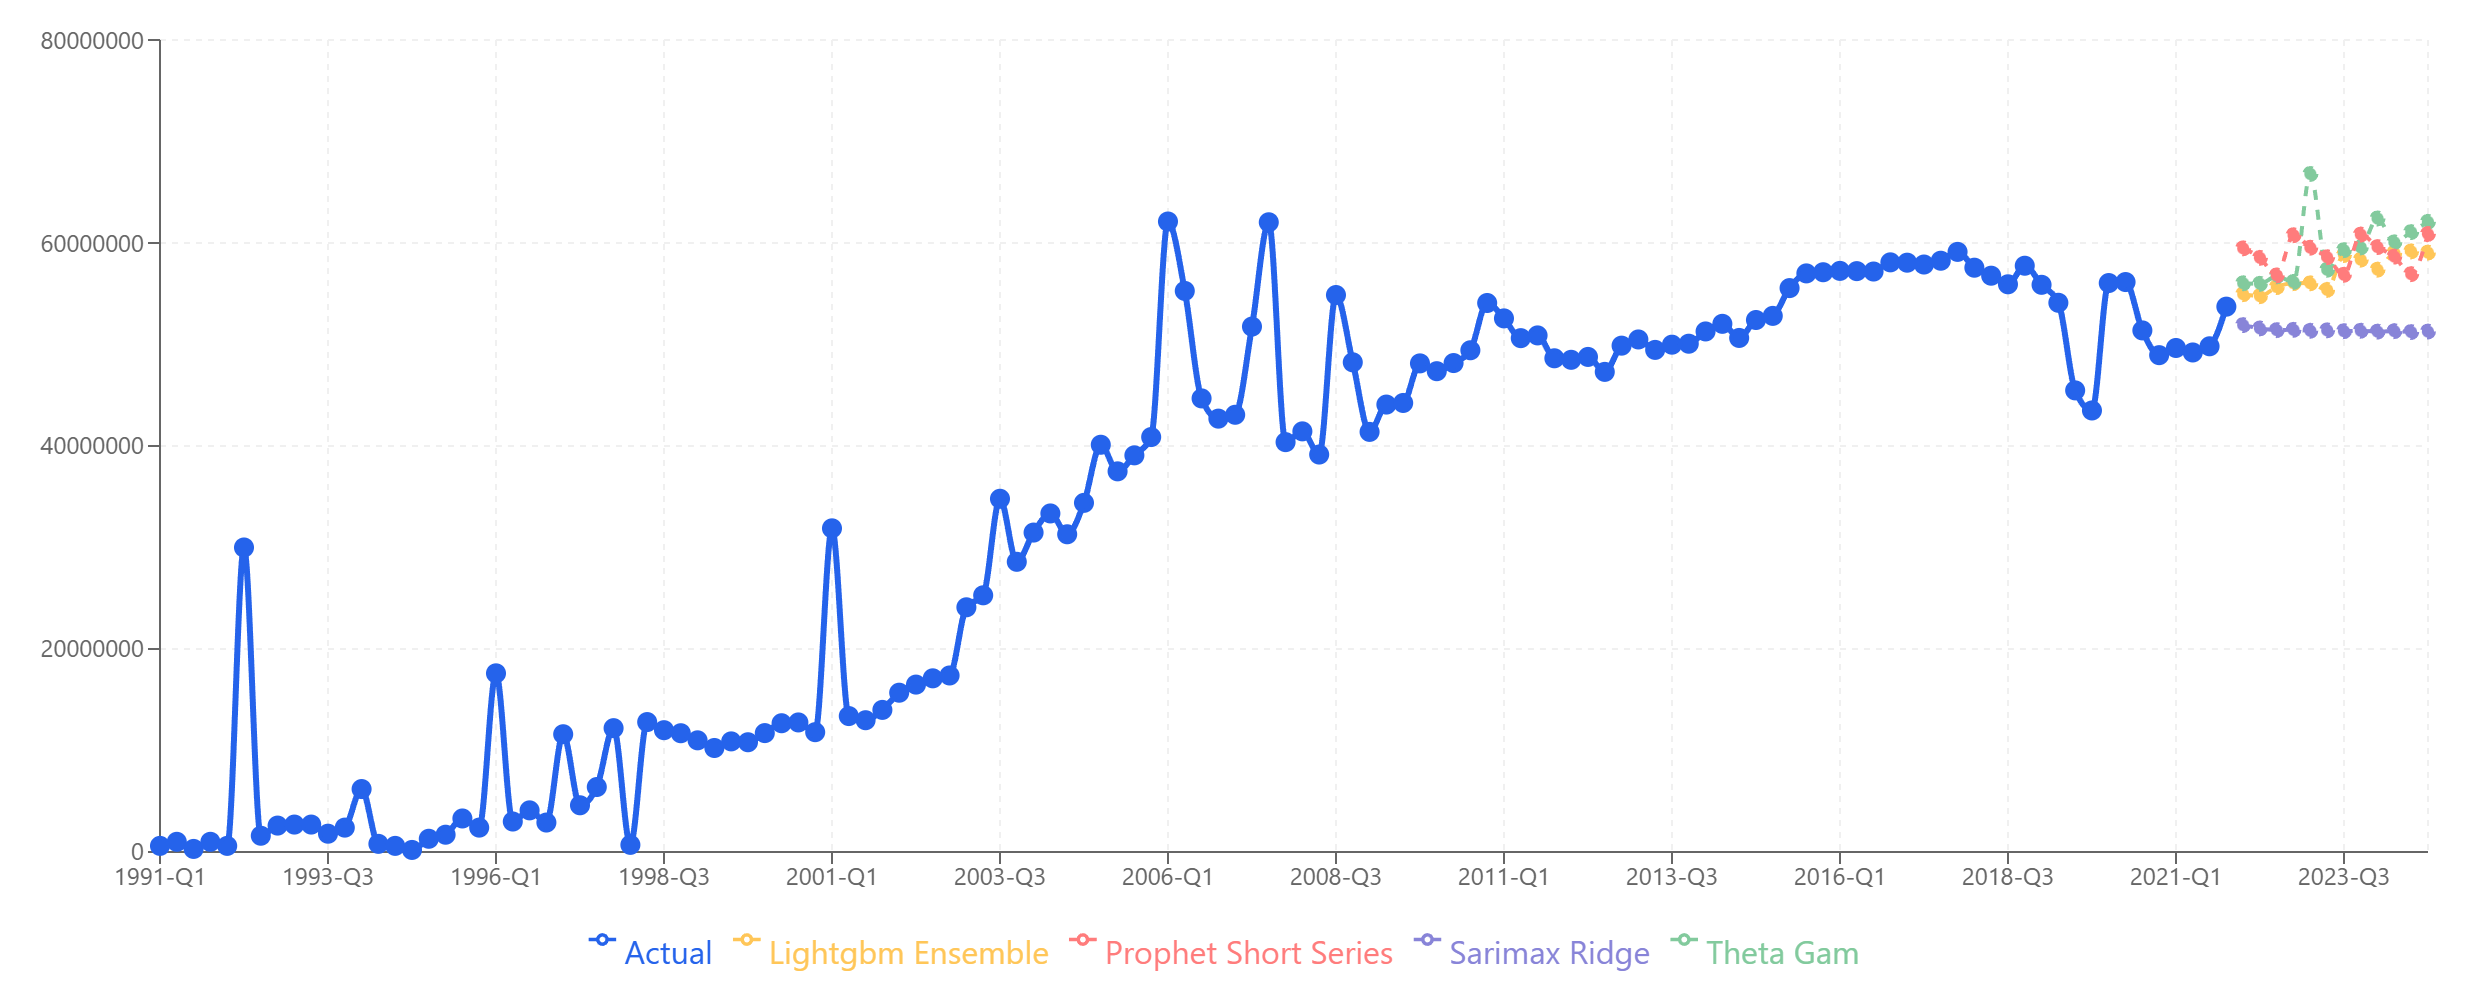 Four models, four different forecasts. Which one is "right"?
Here's what each model predicted versus what actually happened:
| Period | LightGBM | SARIMAX | Theta-GAM | Prophet | Ensemble | Actual |
|---|---|---|---|---|---|---|
| 2022-Q1 | 54.96M | 51.92M | 56.04M | 59.48M | 55.60M | 53.05M |
| 2022-Q2 | 54.76M | 51.59M | 55.98M | 58.54M | 55.22M | 52.94M |
| 2022-Q3 | 55.66M | 51.42M | 56.72M | 56.81M | 55.15M | 53.67M |
| 2022-Q4 | 56.05M | 51.45M | 56.17M | 60.77M | 56.11M | 55.41M |
| 2023-Q1 | 56.03M | 51.35M | 66.80M | 59.54M | 58.43M | 62.94M |
| 2023-Q2 | 55.39M | 51.40M | 57.37M | 58.60M | 55.69M | 61.40M |
| 2023-Q3 | 58.82M | 51.31M | 59.30M | 56.87M | 56.58M | 53.39M |
| 2023-Q4 | 58.36M | 51.36M | 59.57M | 60.83M | 57.53M | 55.68M |
| 2024-Q1 | 57.38M | 51.27M | 62.42M | 59.60M | 57.67M | 55.91M |
| 2024-Q2 | 59.03M | 51.32M | 60.07M | 58.66M | 57.27M | 54.92M |
| 2024-Q3 | 59.17M | 51.23M | 61.08M | 56.94M | 57.10M | 51.59M |
| 2024-Q4 | 59.05M | 51.27M | 62.09M | 60.90M | 58.33M | 53.42M |
Now let's calculate the Mean Absolute Percentage Error (MAPE) for each approach:
| Model | MAPE |
|---|---|
| Ensemble | 5.51% |
| SARIMAX-Ridge | 6.83% |
| LightGBM | 6.92% |
| Prophet | 8.49% |
| Theta-GAM | 8.74% |
The ensemble—a simple average of all four models—achieved the lowest error rate, beating even the best individual model by 1.3 percentage points.
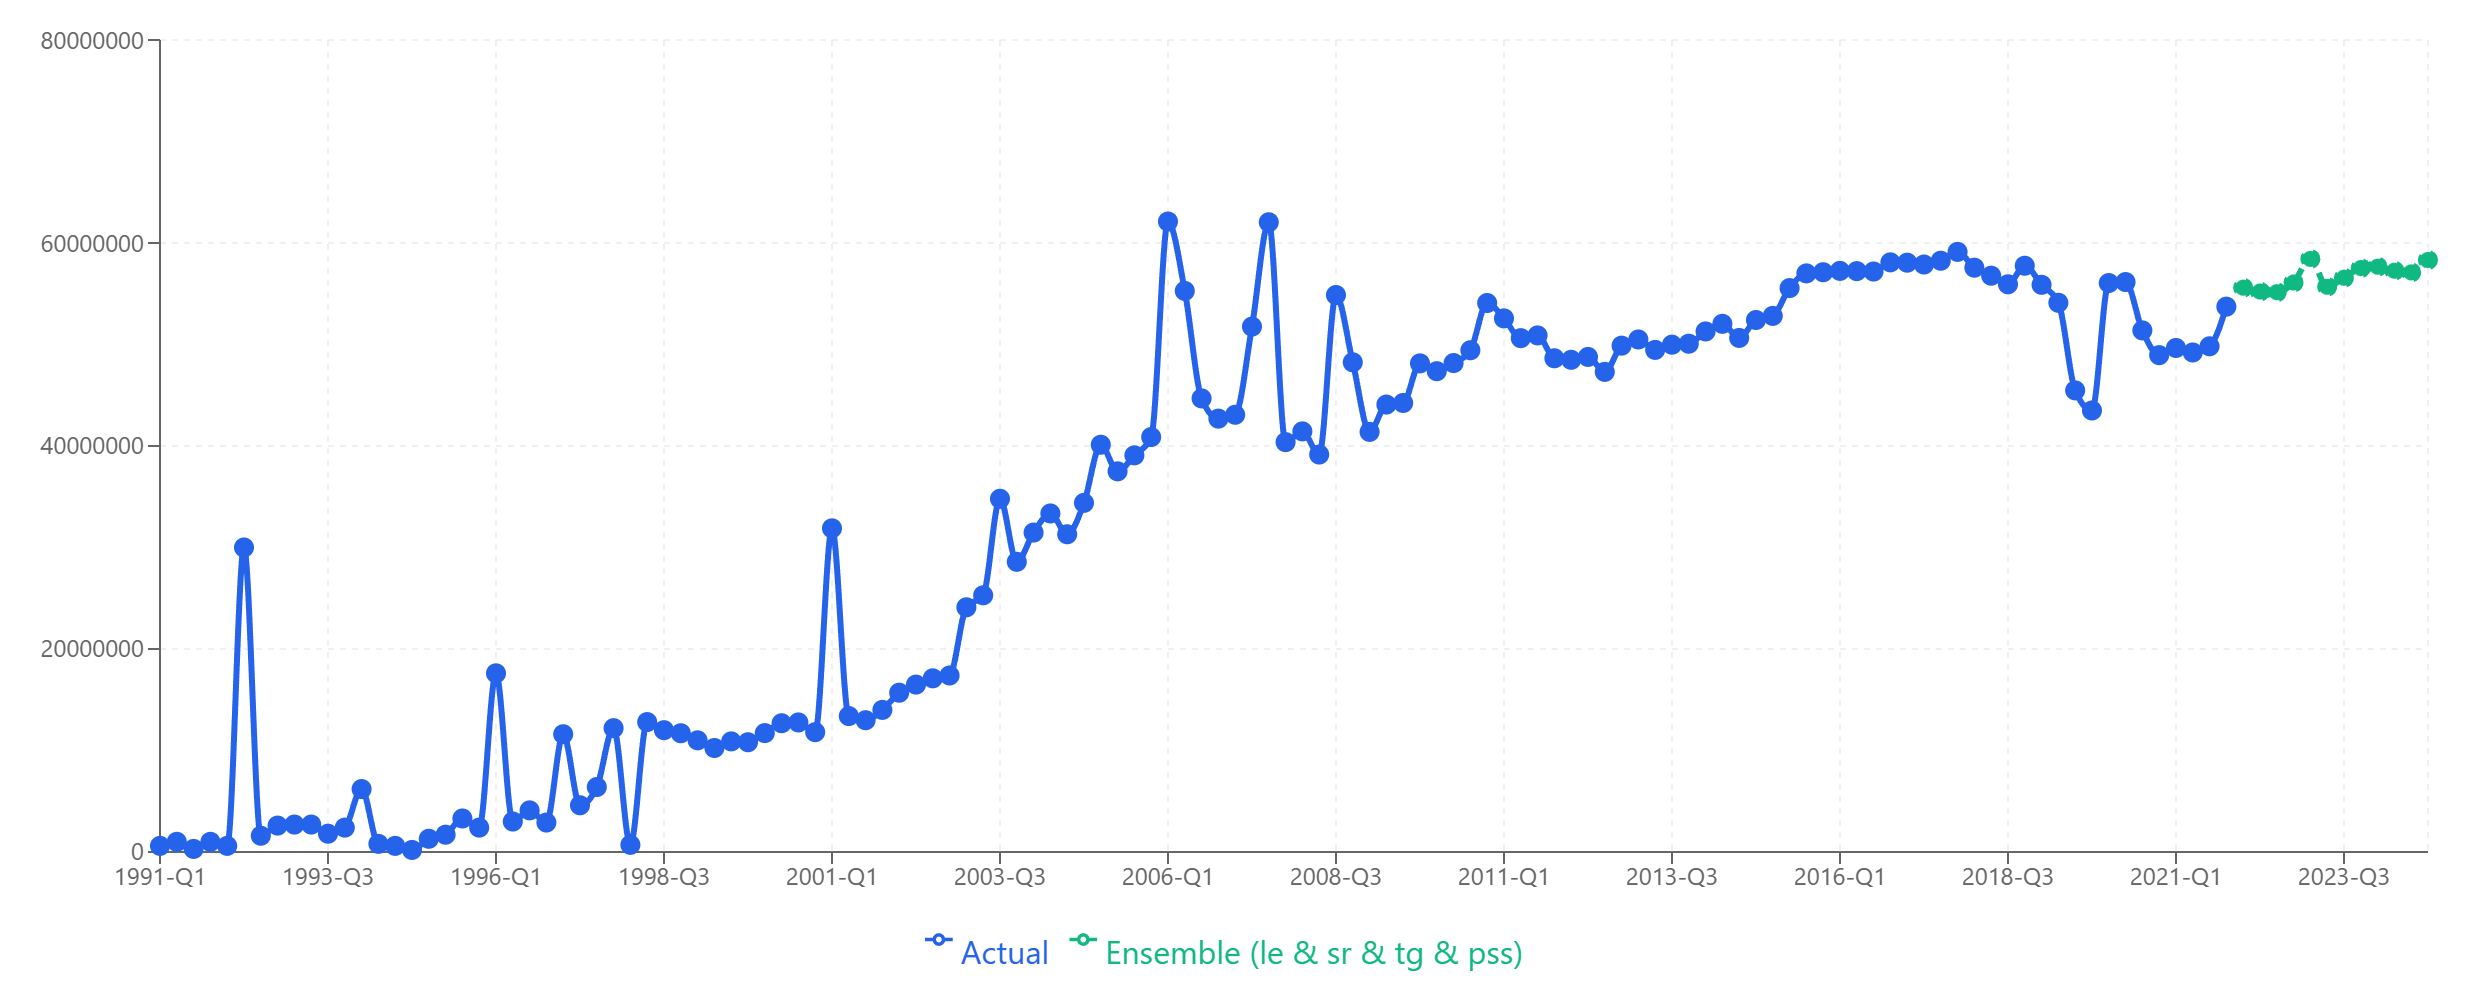 The ensemble forecast (green) smooths out individual model volatility.
Why Does This Work?
The ensemble outperforms for a simple statistical reason: uncorrelated errors cancel out.
Consider 2022-Q4, where the actual value was €55.41M:
- LightGBM overshot by €0.64M (+1.1%)
- SARIMAX undershot by €3.97M (-7.2%)
- Theta-GAM overshot by €0.76M (+1.4%)
- Prophet overshot by €5.36M (+9.7%)
The ensemble prediction of €56.11M overshot by just €0.70M (+1.3%)—better than three of the four individual models.
This isn't magic. It's what happens when you combine predictions that err in different directions. Over 12 quarters, the models' biases partially offset each other.
When Ensembles Work Best
Ensemble forecasting shines when:
1. Models produce plausible but different predictions
If all four models cluster tightly around €55M, the ensemble won't add much. But if they spread from €51M to €62M, you're getting diverse perspectives that can be productively combined.
2. You don't have strong prior knowledge about which model fits best
If you know your data has strong seasonality and Prophet historically nails it, maybe trust Prophet. But if you're forecasting a new product line or entering a new market, model uncertainty is high—and ensembles hedge that uncertainty.
3. The forecast horizon is medium to long-term
Short-term forecasts (1-2 periods) may be dominated by recent momentum that one model captures well. Longer horizons involve more uncertainty where ensemble averaging pays off.
4. Accuracy matters more than interpretability
A single model's forecast is easier to explain: "Prophet detected a trend change in Q3 2021." An ensemble is a black box that's harder to narratively justify—but often more accurate.
When to Skip Ensembles
Don't blindly combine models. Ensembles can hurt when:
One model is clearly wrong
Including it in the ensemble might drag down accuracy. You might get better results ensembling only the other three.
Models are highly correlated
If you run three variations of gradient boosting, their errors will be correlated. Averaging them won't help much—you're just averaging similar mistakes.
You need point forecasts for downstream systems
Some inventory or financial planning systems want a single number, not a range. While ensembles give you a central estimate, you lose the confidence intervals that individual models provide.
How to Build an Ensemble in Sanvia
Building an ensemble takes three clicks:
- Run your forecast with multiple models selected
- On the results page, click Ensemble
- Select which models to include (or use all)
Sanvia calculates a simple average across selected models for each forecast period. You can then compare the ensemble against individual models and export whichever you prefer.
For more advanced use cases, you can also:
- Weight models differently: If LightGBM historically outperforms on your data, give it 40% weight vs. 20% for others
- Exclude outlier models: Drop any model that seems systematically biased
- Ensemble subsets: Try combining just the top 2 performers
Practical Recommendations
Based on our analysis and experience across hundreds of forecasts:
Start with a simple average of all models. It's robust and requires no tuning. In most cases, it will match or beat your best individual model.
Look at the spread between models. If predictions range widely (>15-20% difference between highest and lowest), the ensemble is likely adding value. If they're tightly clustered (<5%), you could just pick any one.
Review ensemble vs. individual performance regularly. Your data patterns may shift. A model that was dragging down the ensemble might start outperforming—or vice versa.
Don't ensemble when you have domain knowledge. If you know a structural change is coming (new product launch, market entry, regulatory change), individual models that can incorporate that knowledge may beat a backward-looking ensemble.
The Bottom Line
Ensemble forecasting isn't a silver bullet, but it's one of the easiest ways to improve forecast accuracy without additional data or model tuning.
In our test case, combining four models reduced error from 6.83% (best individual) to 5.51% (ensemble)—a 19% improvement in accuracy with zero extra effort.
When your models disagree, don't agonize over which one to trust. Trust all of them.
Ready to try ensemble forecasting on your data? Start your free trial and run multiple models in minutes.