Excel remains the most popular tool for sales forecasting. It's familiar, flexible, and good enough for many businesses — especially when you're just getting started with forecasting.
In this guide, we'll cover three proven forecasting methods you can implement in Excel today, plus a free template to get you started.
Download the Free Template
Download Excel Template (Free)
The template includes all three methods below, pre-built with formulas. Just paste your data and get forecasts instantly.
What You'll Need
Before we start, gather your historical sales data:
- Monthly or quarterly figures (at least 12 data points, ideally 24+)
- Consistent time periods (no gaps)
- Revenue, units sold, or whatever metric you're forecasting
More history generally means better forecasts. If you only have 6 months of data, your predictions will be less reliable.
The Three Methods at a Glance
Before diving into details, here's how the three methods compare:
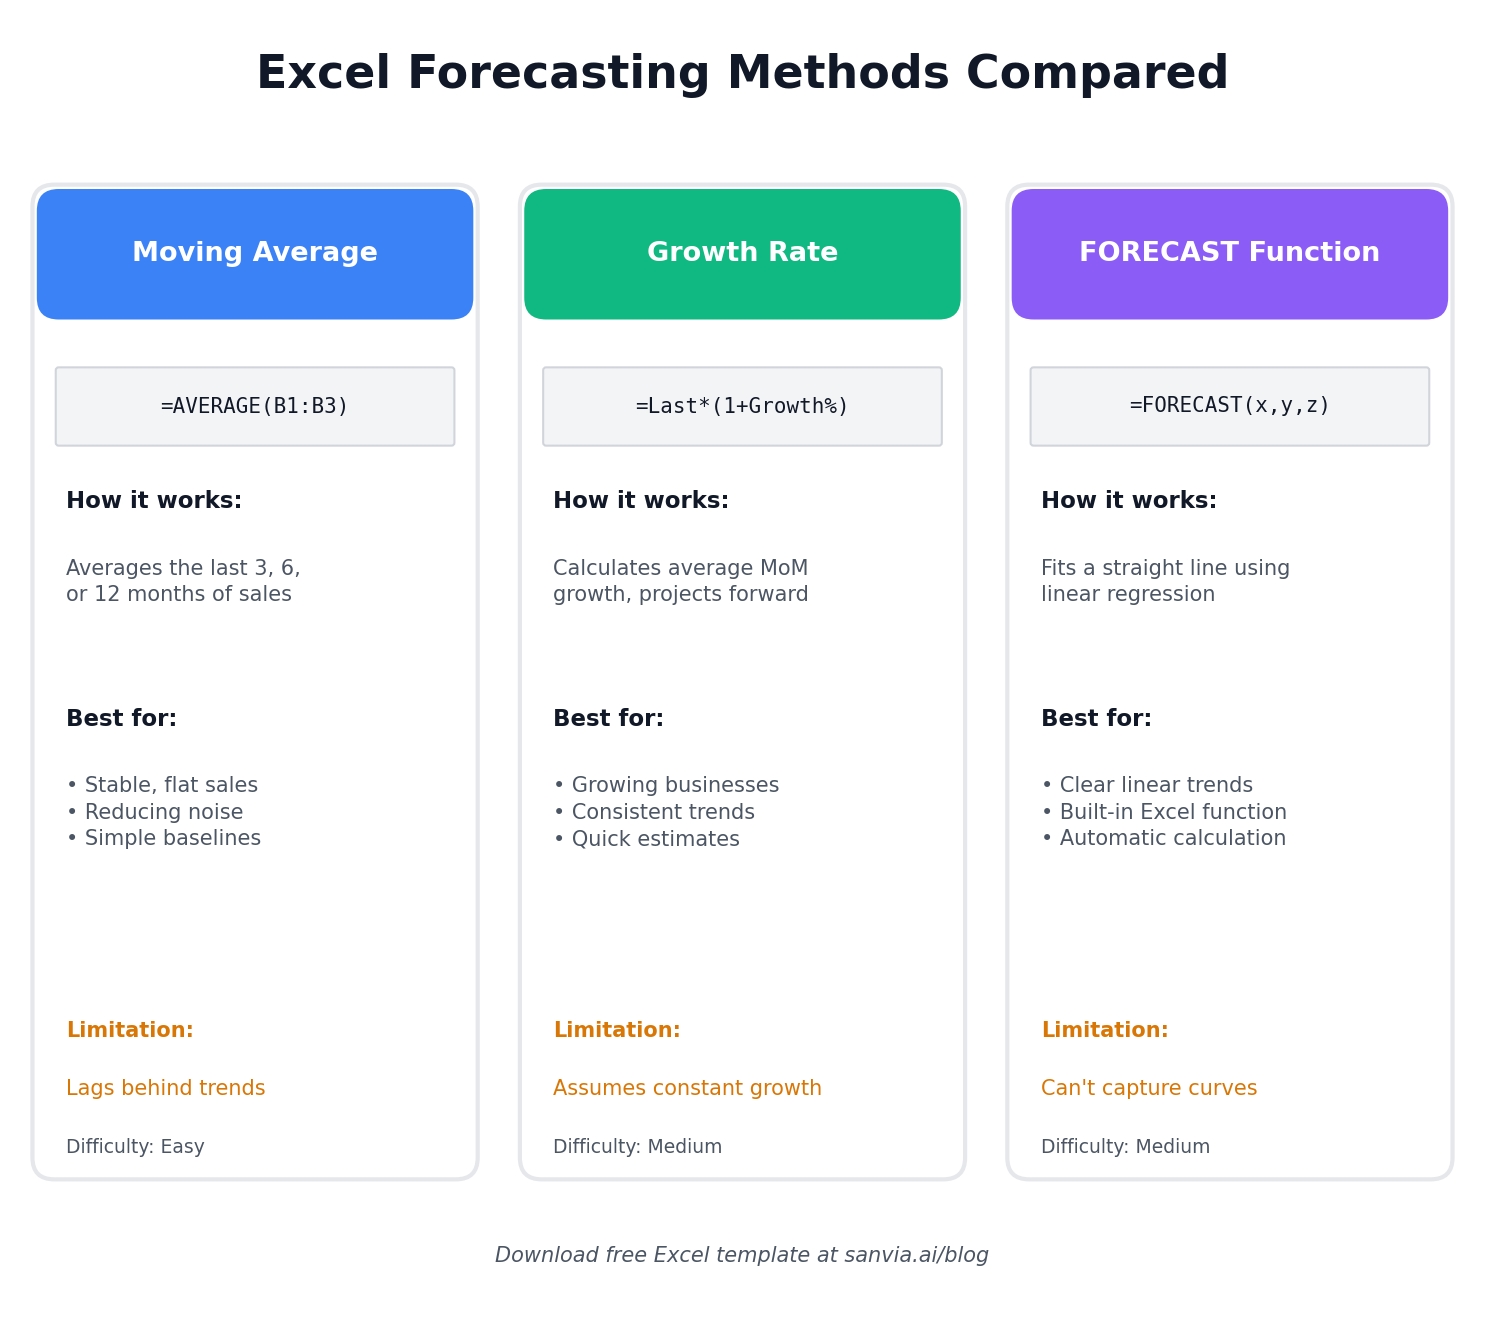
Now let's walk through each method step by step.
Method 1: Moving Average
Best for: Stable businesses with little growth or seasonality
A moving average smooths out short-term fluctuations and shows the underlying trend. It's simple and works well when your sales are relatively flat.
How to Calculate
For a 3-month moving average, the formula averages the last 3 periods:
=AVERAGE(B2:B4)
For month 5's forecast, you'd average months 2, 3, and 4.
Step-by-Step in Excel
- Enter your dates in column A and sales in column B
- In column C (starting at row 4 for a 3-month average), enter:
=AVERAGE(B1:B3) - Drag the formula down
- Extend past your last actual data point to generate forecasts
Choosing the Window Size
| Window | Effect |
|---|---|
| 3 months | More responsive to recent changes |
| 6 months | Smoother, less reactive |
| 12 months | Best for seasonal businesses |
Limitation: Moving averages lag behind trends. If your business is growing, the forecast will always underestimate.
Method 2: Growth Rate Projection
Best for: Growing businesses with consistent month-over-month trends
If your sales are growing (or declining) steadily, applying a growth rate often beats a moving average.
How to Calculate
First, calculate the average growth rate:
Growth Rate = (Current Month / Previous Month) - 1
Then apply it to project forward:
Forecast = Last Actual × (1 + Growth Rate)
Step-by-Step in Excel
- In column C, calculate each period's growth:
=(B3-B2)/B2 - Find the average growth rate:
=AVERAGE(C2:C13) - For forecasts, multiply the previous period by (1 + growth rate):
=B13*(1+$F$1)where F1 contains your average growth rate
Variations
- Simple average: Use the mean of all historical growth rates
- Weighted average: Give more weight to recent months
- CAGR: Compound annual growth rate for longer-term projections
Limitation: Assumes growth continues at the same rate. Doesn't account for market saturation or seasonality.
Method 3: Linear Regression (FORECAST Function)
Best for: Businesses with clear trends, when you want Excel to do the math
Excel's FORECAST function (or FORECAST.LINEAR in newer versions) fits a straight line through your data and projects it forward.
How to Use
=FORECAST(target_date, known_values, known_dates)
Example:
=FORECAST(A14, $B$2:$B$13, $A$2:$A$13)
This forecasts the value for the date in A14 based on your historical data.
Step-by-Step in Excel
- Ensure your dates are in column A, sales in column B
- Add future dates in column A (below your last actual)
- In column B next to each future date, enter:
=FORECAST(A14,$B$2:$B$13,$A$2:$A$13) - Drag down for additional forecast periods
Adding Confidence with FORECAST.ETS
For data with seasonality, use FORECAST.ETS:
=FORECAST.ETS(target_date, values, timeline, [seasonality])
Set seasonality to 4 for quarterly data, 12 for monthly.
Limitation: Fits a straight line — can't capture curves, plateaus, or complex patterns.
Which Method Should You Use?
| Situation | Recommended Method |
|---|---|
| Stable, flat sales | Moving Average |
| Consistent growth | Growth Rate |
| Clear trend, want simplicity | FORECAST function |
| Strong seasonality | FORECAST.ETS or decomposition |
| Complex patterns | Consider ML tools |
Honest advice: Start with the simplest method that makes sense for your data. If your sales are flat, a moving average is fine. Don't overcomplicate it.
Template Walkthrough
The free template includes:
- Data Input Sheet — Paste your historical sales here
- Moving Average — Auto-calculates 3, 6, and 12-month averages
- Growth Rate — Shows month-over-month growth and projections
- FORECAST — Uses Excel's built-in regression
- Comparison Chart — See all methods side-by-side
- Accuracy Check — Calculates MAPE for each method on held-out data
Download Excel Template (Free)
When Excel Isn't Enough
Excel works great for simple forecasts, but you'll hit limitations as your business grows:
Multiple Products or Regions
Managing 20+ forecast tabs becomes painful. You end up copying formulas, fixing broken references, and losing track of which sheet has the latest version. What starts as a simple spreadsheet turns into a maintenance nightmare.
External Data Makes Forecasts Smarter
Your sales don't exist in a vacuum. They're influenced by economic conditions, industry trends, and seasonal factors that Excel can't easily incorporate.
Machine learning models can automatically integrate external indicators like GDP growth rates, consumer confidence indices, industry-specific metrics, and even weather patterns. These signals help explain why your sales fluctuate — not just that they fluctuate.
For example, a building materials supplier might see sales correlate strongly with construction permits and interest rates. An ML model can learn these relationships and adjust forecasts when economic conditions shift, something a simple moving average will never capture.
The difference is significant. In our testing across 2,000+ company datasets, models that incorporate relevant external indicators typically improve forecast accuracy by 15-25% compared to univariate methods (those using only historical sales data).
Pattern Recognition Beyond Linear Trends
Excel's FORECAST function fits a straight line. But real sales data rarely follows straight lines forever.
ML models like gradient boosting (LightGBM) and Prophet can automatically detect and adapt to trend changes and inflection points, multiple overlapping seasonalities (weekly, monthly, yearly), holiday effects and promotional impacts, and non-linear growth patterns like S-curves.
They learn from your data's actual behavior rather than forcing it into a predetermined shape.
Diverse Model Selection
Different products and regions often need different forecasting approaches. A stable product line might work best with simple smoothing, while a fast-growing new product needs something that captures momentum.
ML platforms can offer multiple models for your data which makes selection of the best performer for each SKU or segment easier — something that would take hours to do manually in Excel.
Next Steps
- Download the template and plug in your data
- Compare the three methods — see which best matches your historical patterns
- Test accuracy — hide the last 3-6 months, forecast them, and check MAPE
If you want to go beyond Excel with machine learning models, external economic indicators, and automatic model comparison, try Sanvia free for 14 days.
Questions about the template or forecasting methods? Email us at support@sanvia.ai