Getting inventory wrong is expensive. Stockouts mean lost sales and frustrated customers. Overstock ties up cash and fills your warehouse with products that might never sell.
The difference between businesses that nail inventory and those that don't? It comes down to three calculations — and the forecast accuracy behind them.
The Real Cost of Getting It Wrong
Inventory mistakes hit your business from both sides:
Stockouts cost you:
- Lost sales (customers buy from competitors)
- Damaged reputation and customer trust
- Emergency expedited shipping to recover
- Missed growth opportunities
Overstock costs you:
- Cash tied up in unsold inventory
- Warehouse space and carrying costs
- Markdowns and write-offs
- Obsolescence risk (especially for seasonal or perishable goods)
Studies suggest stockouts alone cost retailers 4-8% of annual revenue. For a business doing €1M in sales, that's €40-80K walking out the door.
The solution isn't holding more inventory "just in case." It's holding the right amount — and that requires understanding three core concepts.
The Three Pillars of Inventory Planning
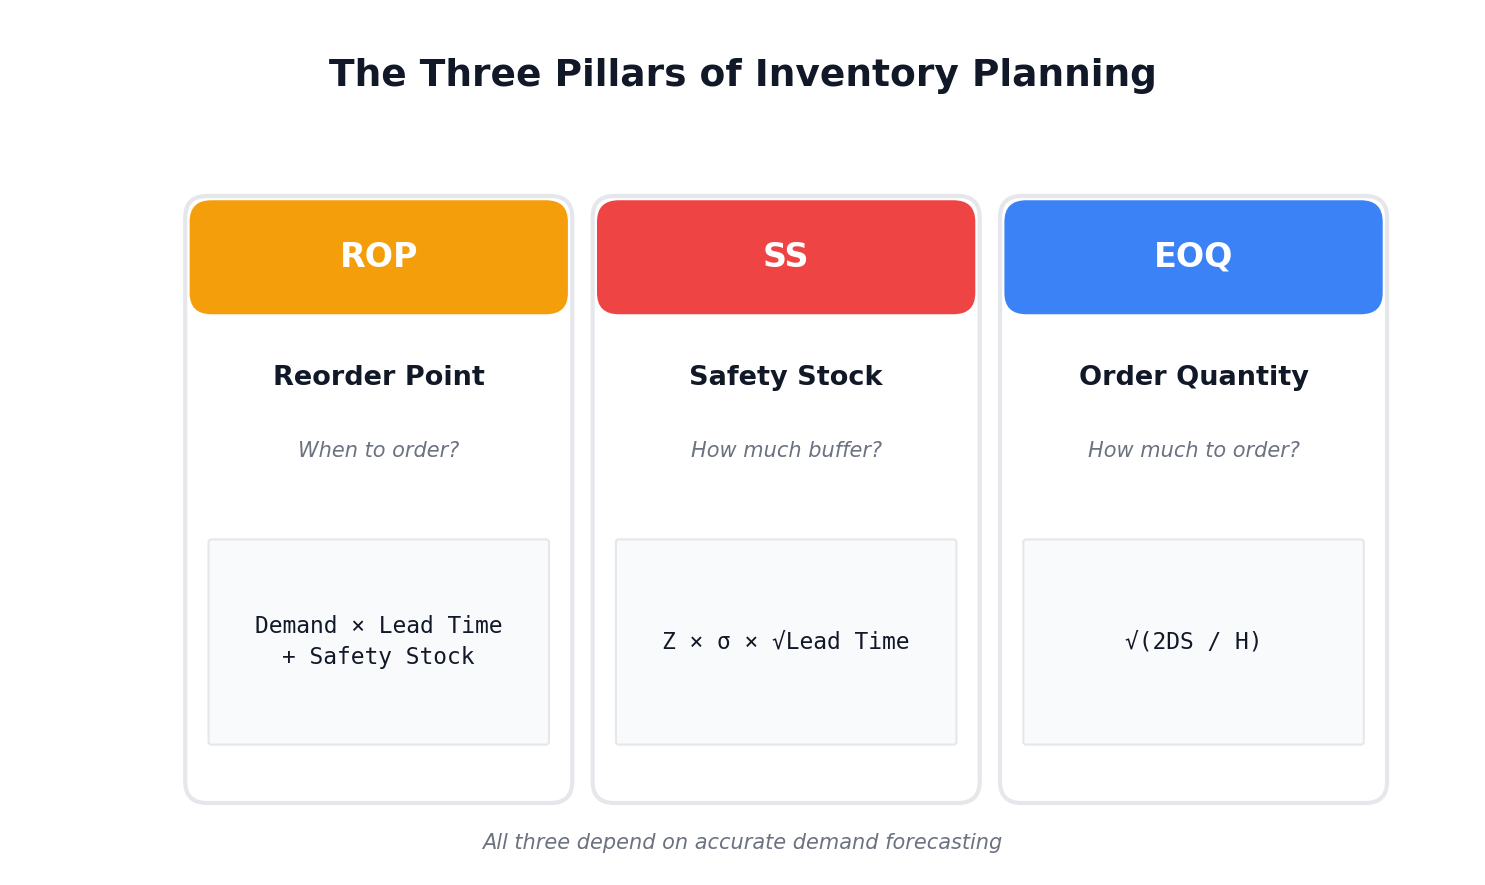
1. Reorder Point (ROP)
What it is: The inventory level that triggers a new order.
Formula:
Reorder Point = (Average Daily Demand × Lead Time) + Safety Stock
Example: You sell 20 units/day, supplier lead time is 10 days, and your safety stock is 50 units.
ROP = (20 × 10) + 50 = 250 units
When inventory hits 250 units, place an order.
2. Safety Stock
What it is: Buffer inventory to protect against demand variability and supply delays.
Formula:
Safety Stock = Z × σ × √Lead Time
Where:
- Z = Service level factor (1.65 for 95%, 2.33 for 99%)
- σ = Standard deviation of demand
- Lead Time = Days until order arrives
Why it matters: Safety stock is where forecast accuracy directly impacts your cash. Higher demand uncertainty = more safety stock required = more cash tied up.
3. Economic Order Quantity (EOQ)
What it is: The optimal order size that minimizes total inventory costs.
Formula:
EOQ = √(2 × Annual Demand × Order Cost / Holding Cost per Unit)
Example: Annual demand is 10,000 units, each order costs €50 to place, and holding cost is €2/unit/year.
EOQ = √(2 × 10,000 × 50 / 2) = √500,000 = 707 units
Order ~700 units at a time for optimal cost efficiency.
Why Forecasting Is the Foundation
Here's what most inventory guides don't tell you: all three calculations above depend on your demand forecast.
- Reorder Point uses average daily demand — a forecast
- Safety Stock uses demand variability — forecast error
- EOQ uses annual demand — a forecast
If your forecast is wrong, your inventory math is wrong. It's that simple.
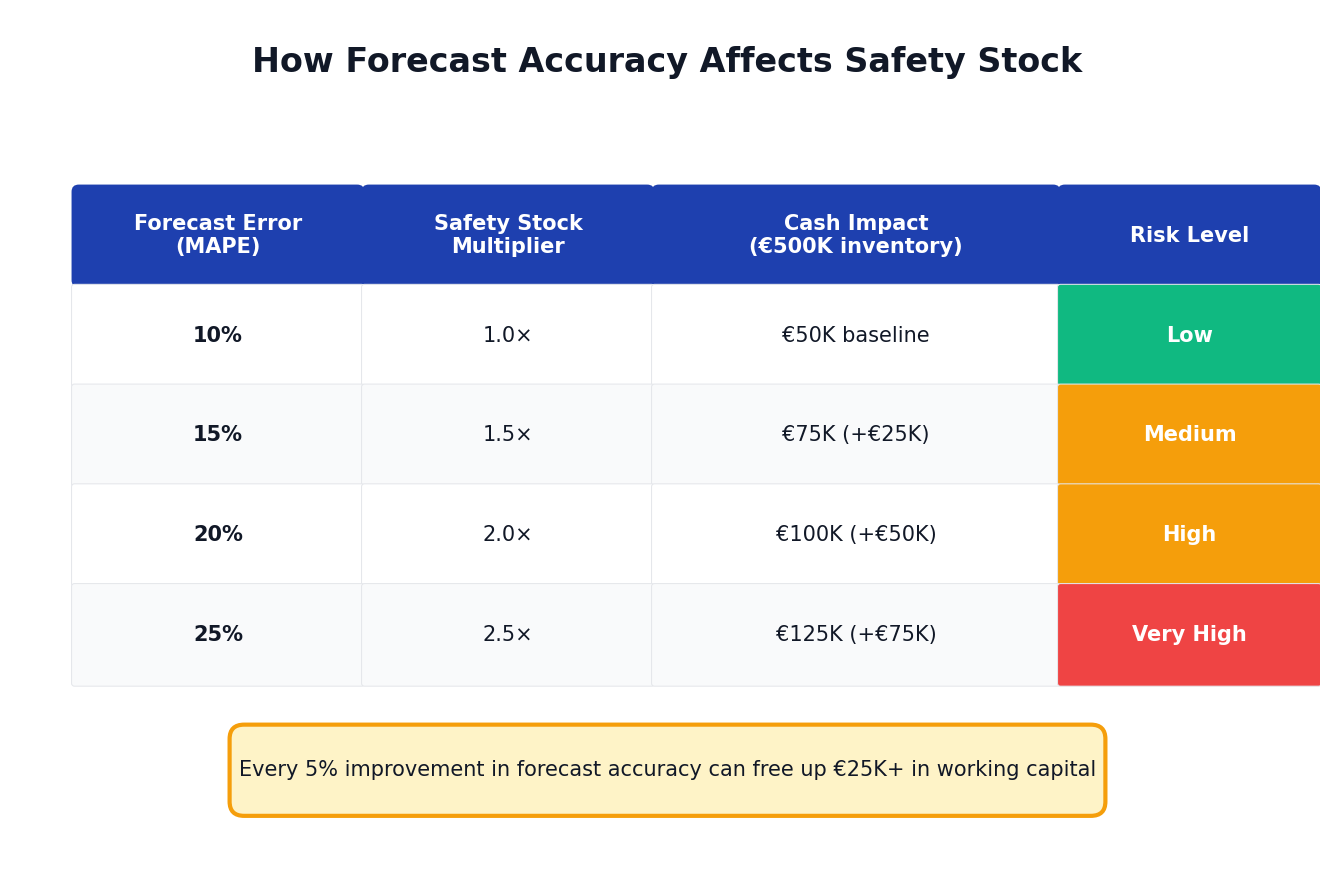
The table above shows the real impact. At 25% forecast error (MAPE), you need nearly 2.5x more safety stock than at 10% error. That's cash sitting in your warehouse instead of growing your business.
This is why forecast accuracy matters for operations, not just finance.
Calculate Safety Stock in Excel (Step-by-Step)
Let's walk through a practical example.
Your Data
| Month | Units Sold |
|---|---|
| Jan | 480 |
| Feb | 520 |
| Mar | 510 |
| Apr | 490 |
| May | 530 |
| Jun | 470 |
Step 1: Calculate Average Demand
=AVERAGE(B2:B7)
Result: 500 units/month → ~16.7 units/day
Step 2: Calculate Standard Deviation
=STDEV(B2:B7)
Result: 23.8 units/month
Step 3: Choose Your Service Level
| Service Level | Z-Score | Meaning |
|---|---|---|
| 90% | 1.28 | Stockout risk: 10% |
| 95% | 1.65 | Stockout risk: 5% |
| 99% | 2.33 | Stockout risk: 1% |
Let's use 95% (Z = 1.65).
Step 4: Calculate Safety Stock
Assuming 14-day lead time (0.47 months):
Safety Stock = 1.65 × 23.8 × √0.47 = 26.9 ≈ 27 units
Step 5: Calculate Reorder Point
ROP = (16.7 × 14) + 27 = 234 + 27 = 261 units
Result: Order more inventory when you hit 261 units, maintaining 27 units of safety stock.
The Inventory Lifecycle: Visualized
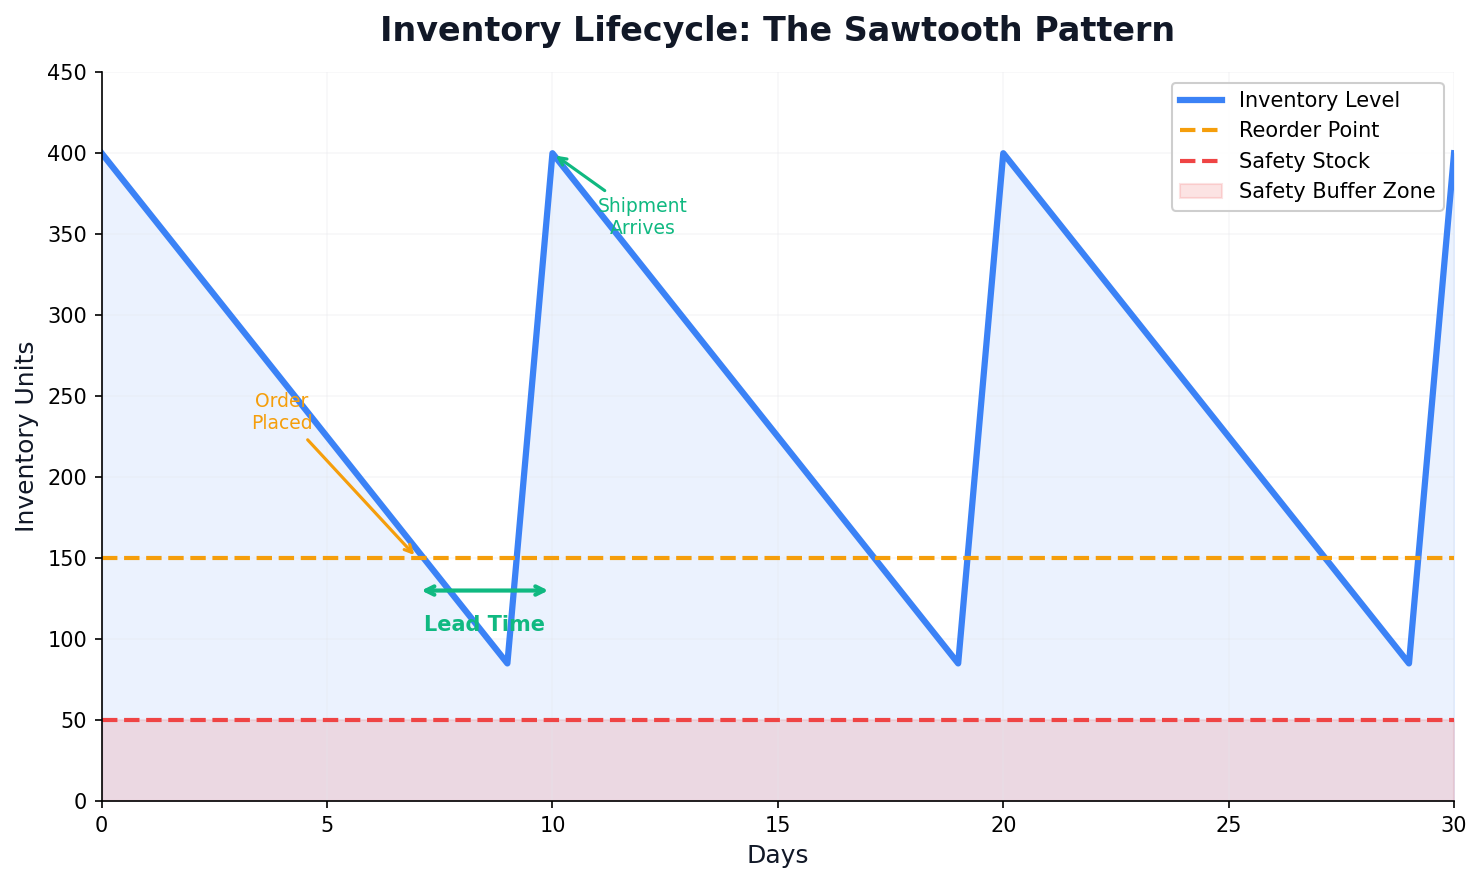
This classic "sawtooth" pattern shows how inventory planning works in practice:
- Inventory depletes as you sell
- When you hit the reorder point, place an order
- Safety stock protects you during lead time
- New shipment arrives, inventory replenishes
- Cycle repeats
The goal is to never dip into safety stock under normal conditions — it's your insurance policy, not your operating inventory.
Signs You've Outgrown Spreadsheets
Excel works fine for simple inventory planning. But you'll hit limits when:
Your product catalog grows. Managing reorder points for 20 SKUs is tedious. For 200 SKUs, it's a full-time job.
Demand patterns get complex. Seasonality, promotions, and trends require more sophisticated forecasting than moving averages.
Forecast errors stay high. If your MAPE is stuck above 20%, you're carrying excess safety stock and still getting stockouts.
Lead times vary. Supplier reliability affects safety stock calculations, but modeling this in Excel is painful.
The Payoff of Better Forecasts
Here's the business case: every percentage point improvement in forecast accuracy reduces required safety stock.
For a business with €500K in inventory:
- Improving MAPE from 25% → 15% could free up €75-100K in working capital
- Fewer stockouts mean 2-4% revenue recovery
- Lower carrying costs (typically 20-30% of inventory value annually)
This is where ML-powered forecasting earns its keep. Not by being "fancy," but by being more accurate — which translates directly to leaner inventory and fewer stockouts.
Download the Free Calculator
We've built an Excel template that calculates safety stock and reorder points automatically. Just plug in your data.
Download Inventory Planning Calculator (Free)
Next Steps
- Download the calculator and run the numbers for your top 10 SKUs
- Calculate your current forecast accuracy — are you at 10% error or 30%?
- Identify the gap — how much safety stock could you eliminate with better forecasts?
If you're ready to improve forecast accuracy with ML models that incorporate seasonality, trends, and external factors, try Sanvia free for 14 days.
Questions about inventory planning? Email us at support@sanvia.ai