Every business decision you make—hiring, inventory, marketing spend, cash flow management—depends on some assumption about future sales. The question isn't whether you forecast, but whether you do it systematically or leave it to intuition.
The good news: you don't need a statistics degree to forecast effectively. The challenge: with dozens of methods available, knowing which one fits your situation can feel overwhelming.
This guide cuts through the complexity. We'll cover the major forecasting approaches, when each one shines, and how to choose the right method for your business. Whether you're forecasting next month's revenue or planning three years ahead, you'll walk away with a clear framework for making better predictions.
Two Families of Forecasting
Before diving into specific techniques, it helps to understand that all forecasting methods fall into two broad categories:
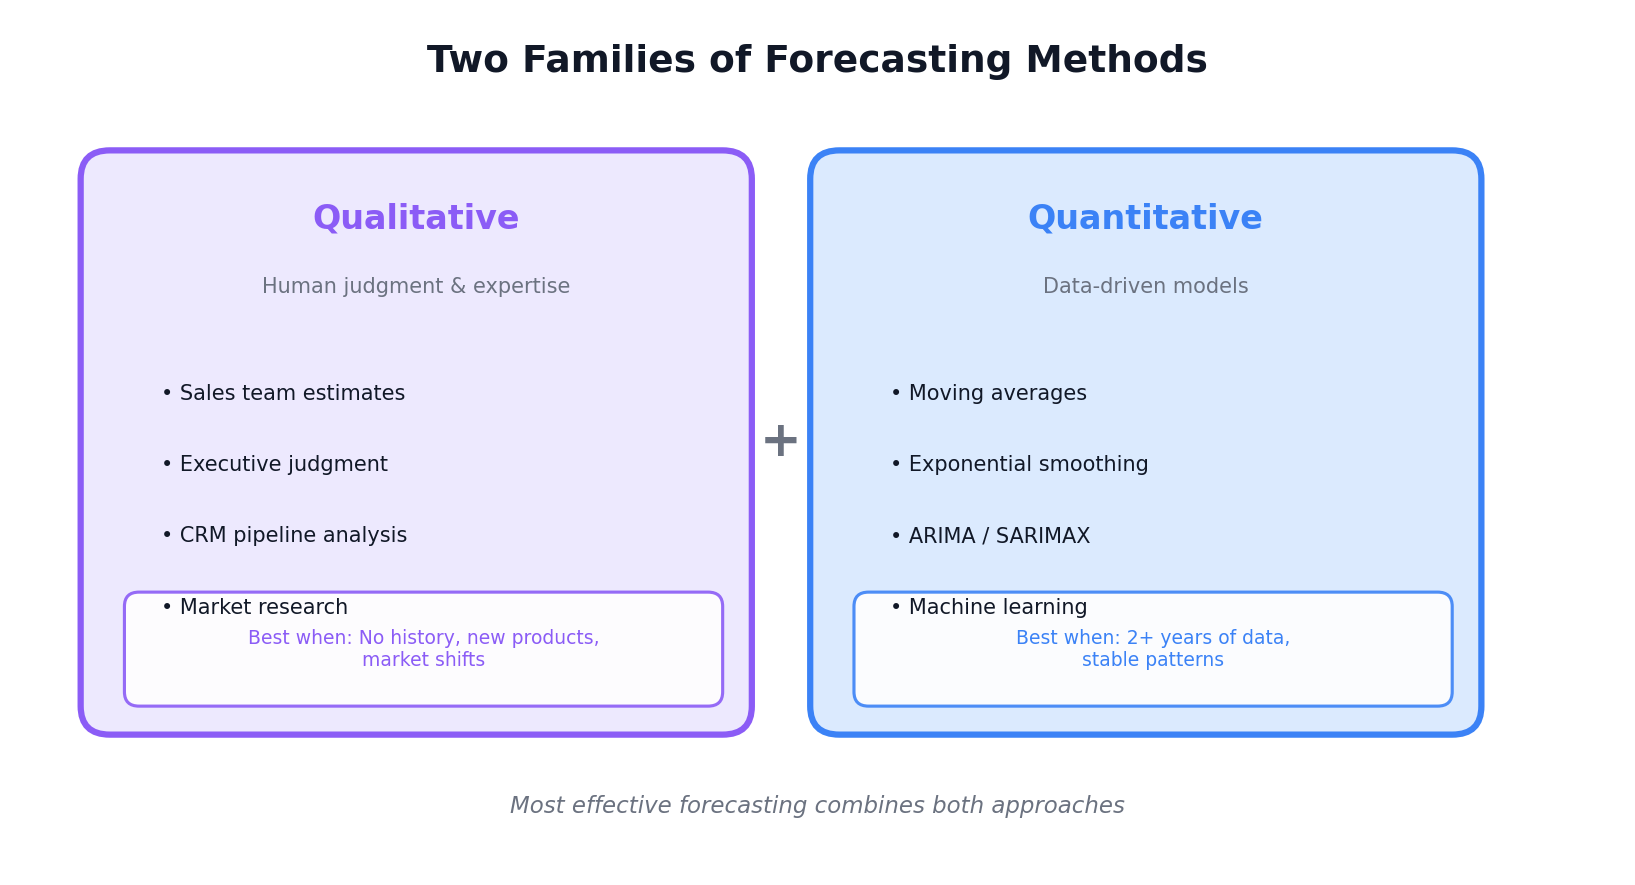 Qualitative methods rely on human judgment; quantitative methods let data lead. Most effective forecasting combines both.
Qualitative methods rely on human judgment, expert opinion, and market intelligence. They're essential when you lack historical data or when the future will look fundamentally different from the past.
Quantitative methods use historical data and mathematical models to identify patterns and project them forward. They excel when you have consistent data and relatively stable business conditions.
Most mature forecasting practices combine both—using quantitative models as a baseline and qualitative judgment to adjust for known events or market shifts.
Qualitative Methods: When Data Isn't Enough
Qualitative forecasting isn't guessing—it's structured judgment. These methods are invaluable for new products, market entries, or periods of significant change where historical patterns don't apply.
Sales Team Input (Bottom-Up)
Your sales team talks to customers daily. They know which deals are likely to close, which accounts are expanding, and where the market is heading. Aggregating their estimates creates a forecast grounded in front-line intelligence.
Advantages: Captures information no model can see (customer conversations, competitive moves). Creates buy-in—people own forecasts they helped create. Works well for B2B businesses with identifiable deals.
Disadvantages: Prone to optimism bias (reps overestimate close rates). Inconsistent assumptions across team members. Time-consuming to collect and reconcile.
Best for: B2B companies with longer sales cycles, businesses entering new markets.
CRM-Based Pipeline Forecasting
Modern CRMs like Salesforce and HubSpot include built-in forecasting features that analyze your pipeline—deals in progress, stage probabilities, and historical close rates—to predict future revenue.
Advantages: Automated data collection from existing workflow. Standardized probability weighting by deal stage. Real-time updates as pipeline changes. Native integration with sales process.
Disadvantages: Only as good as your pipeline hygiene (garbage in, garbage out). Limited to known opportunities—misses organic growth and inbound. Assumes future close rates match historical rates. Doesn't incorporate external factors like economic conditions or seasonality.
Best for: B2B sales-driven organizations with disciplined CRM usage.
Executive Judgment (Top-Down)
Leadership sets targets based on strategic goals, market analysis, and competitive positioning. This approach moves fast and incorporates context that doesn't appear in historical data.
Advantages: Quick to produce. Incorporates strategic direction and market intelligence. Useful for long-range planning and investor communication.
Disadvantages: Can be disconnected from operational reality. Risk of anchoring to arbitrary targets. Hard to validate until it's too late.
Best for: Annual planning, scenario analysis, new venture projections.
When to Use Qualitative Methods
Lean on qualitative approaches when launching a new product with no sales history, entering a new market or customer segment, anticipating a major market shift, or when your historical data is unreliable or too short.
The key is treating qualitative forecasting as a discipline, not a free-for-all. Document assumptions, track accuracy over time, and calibrate your judgment based on results.
Quantitative Methods: Letting Data Lead
When you have two or more years of consistent sales data, quantitative methods can identify patterns you might miss—and remove the emotional bias that distorts human judgment.
Here's a tour of the major approaches, from simple to sophisticated.
Naive Methods
The simplest forecast: next period equals this period. Or: next January equals last January. It sounds almost too simple to work, but naive methods are surprisingly hard to beat for short-term forecasts in stable businesses.
Why it matters: Any more complex method should outperform naive forecasting. If it doesn't, you're adding complexity without value. Always benchmark against naive.
Best for: Stable, low-growth businesses; as a baseline for comparison.
Moving Average
Average your last N periods (say, 3 months or 4 quarters) to smooth out noise. Each new period, drop the oldest data point and add the newest.
Advantages: Simple to understand and calculate. Smooths random fluctuations. No specialized tools required.
Disadvantages: Lags behind trends (if sales are rising, the average is always behind). Ignores seasonality. Equal weight to all periods may not reflect reality.
Best for: Volatile data that needs smoothing, businesses without strong seasonality.
Exponential Smoothing
Like moving average, but gives more weight to recent observations. The most recent data matters most; older data fades exponentially. Advanced versions (Holt-Winters) handle both trends and seasonality.
Advantages: Adapts quickly to level changes. Handles trend and seasonality when extended. Well-established, available in most tools. Good balance of simplicity and effectiveness.
Disadvantages: Requires choosing smoothing parameters. Struggles with multiple seasonal patterns. Assumes patterns continue unchanged.
Best for: Sales data with clear seasonality.
ARIMA and SARIMAX
These statistical models capture more complex patterns by analyzing how each observation relates to previous ones (autocorrelation) and accounting for seasonality. SARIMAX can also incorporate external variables like economic indicators.
Advantages: Rigorous statistical foundation. Handles complex seasonal patterns. Can include external predictors (GDP, industry indices). Provides confidence intervals.
Disadvantages: Requires data preparation (stationarity). More parameters to tune. Needs longer time series (40+ periods ideal). Less intuitive to explain.
Best for: Longer time series with complex patterns, when external factors clearly drive sales.
Machine Learning Methods
Algorithms like LightGBM, XGBoost, or neural networks learn patterns from data without explicit programming. They can capture non-linear relationships and use many input features simultaneously.
Advantages: Can model complex, non-linear relationships. Incorporates many features (promotions, weather, economic data). Often wins accuracy competitions. Scales to many products automatically.
Disadvantages: Needs more data to train effectively. Risk of overfitting (memorizing noise instead of patterns). Less interpretable ("black box"). Requires technical expertise to implement well.
Best for: Large datasets, businesses with many SKUs, when external drivers significantly impact sales.
Ensemble Methods
Why choose one model when you can combine several? Ensemble approaches blend forecasts from multiple methods, often outperforming any single model by 10-15%.
Advantages: Reduces risk of any single model failing. Different models capture different patterns. Often the most accurate approach overall.
Disadvantages: More complex to implement and maintain. Harder to explain to stakeholders.
Best for: When accuracy matters most and you have the infrastructure to run multiple models.
We've written a detailed guide on ensemble forecasting if you want to go deeper.
Choosing the Right Method
With so many options, how do you decide? The right method depends on four factors:
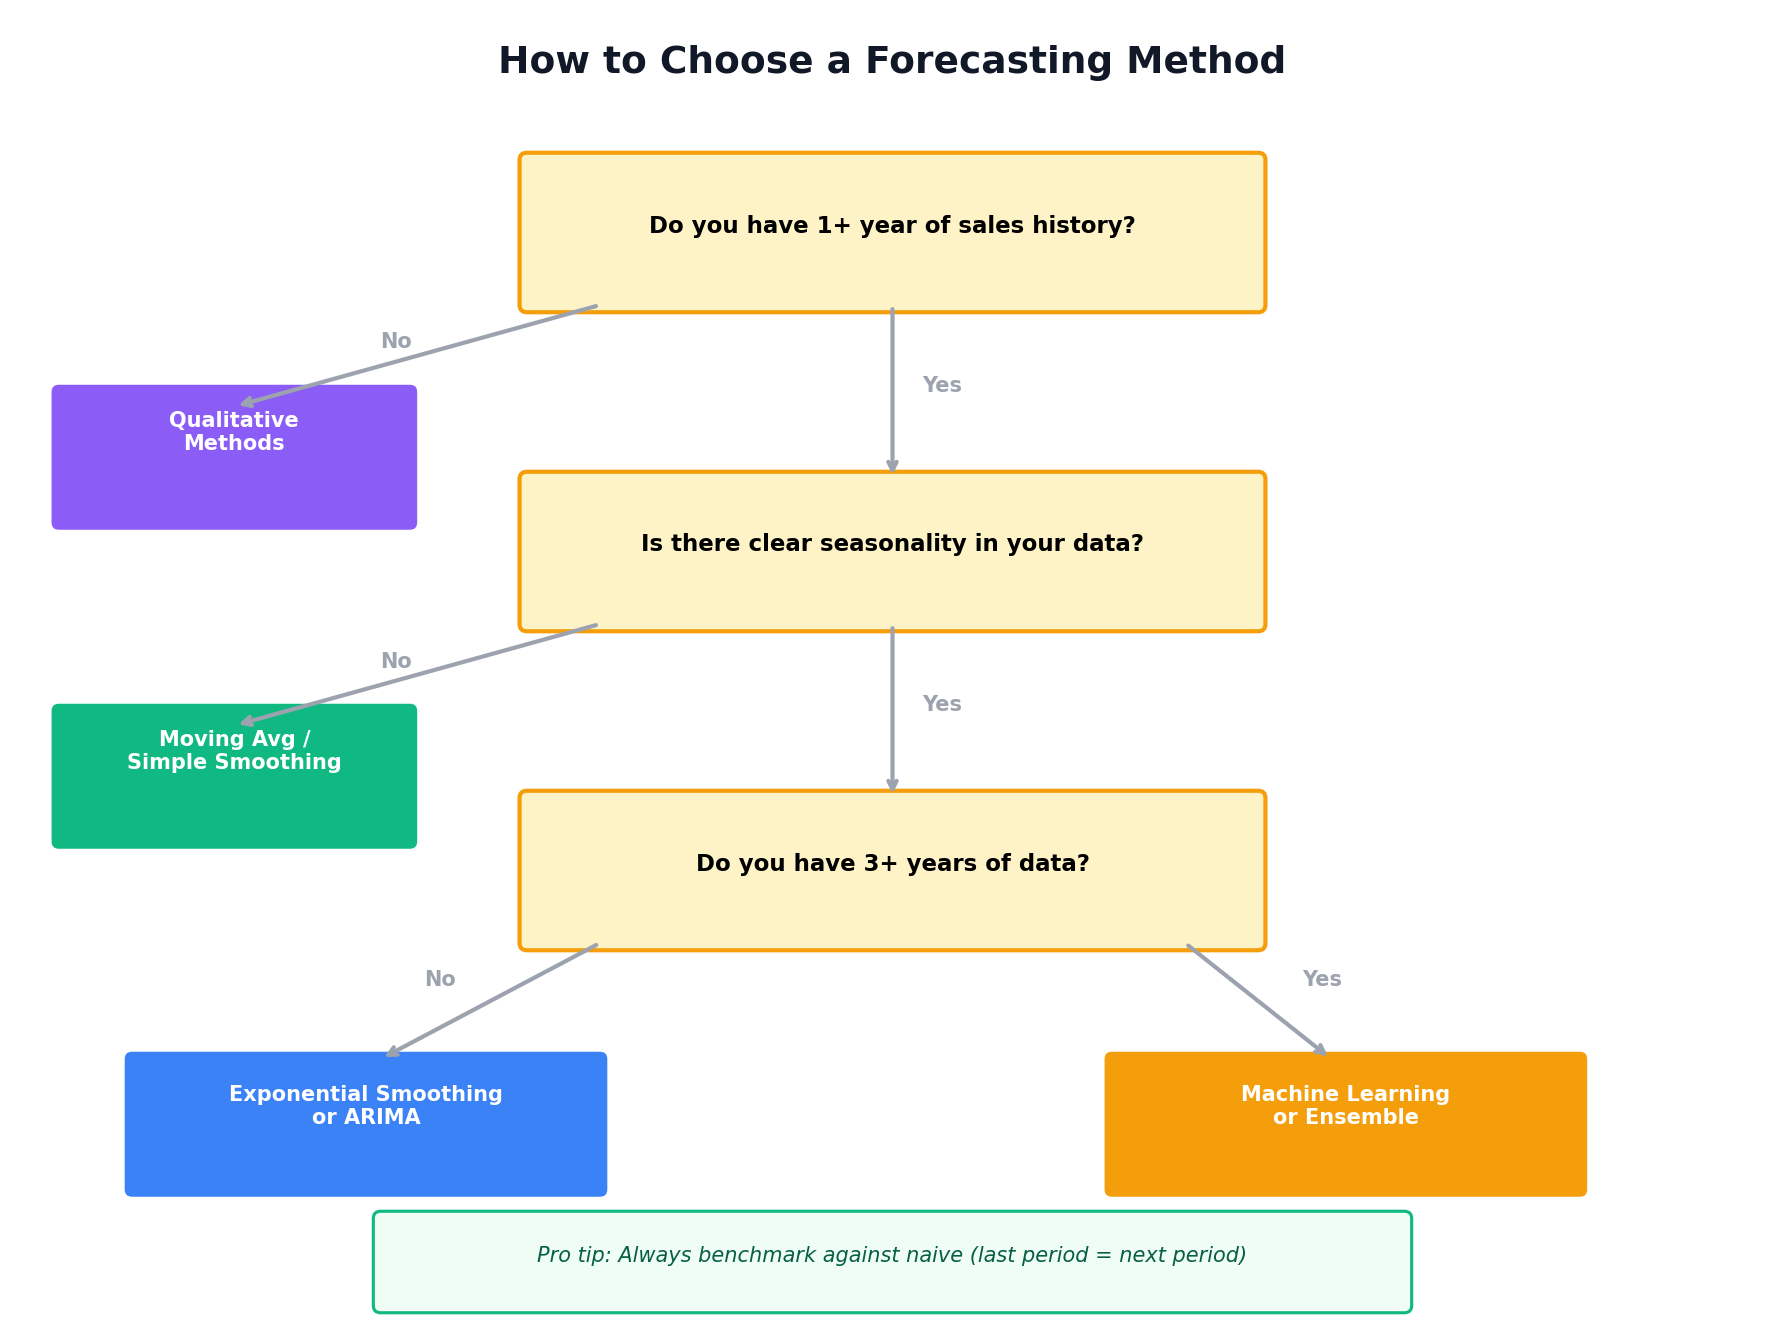 A simple decision tree for method selection. Start with data availability, then consider seasonality and complexity.
How Much Data Do You Have?
This is often the deciding factor. With less than 1 year, stick to qualitative methods or simple quantitative approaches like naive and moving average. With 1-2 years, exponential smoothing and basic seasonal models become viable. With 2-5 years, you can use the full range of statistical methods. With 5+ years and many products, machine learning becomes a realistic option.
What's Your Forecast Horizon?
Different methods suit different time frames. For next week or month, naive or exponential smoothing often suffice. For next quarter, seasonal models add value. For 1-3 years out, statistical models with external variables or hybrid approaches work best.
How Complex Are Your Patterns?
Match method sophistication to pattern complexity. Stable data with no trend needs only naive or simple moving average. Clear trends call for exponential smoothing with a trend component. Seasonality requires Holt-Winters, SARIMAX, or ML. Multiple seasonalities plus external drivers warrant ML or advanced statistical models.
What Resources Do You Have?
Be realistic about your constraints. Spreadsheet-only environments limit you to moving average and simple exponential smoothing. Basic analytics tools enable Holt-Winters and pre-built ARIMA. Data science capability opens up full ML pipelines and custom ensembles. Dedicated platforms automate method selection and combination.
Method Comparison at a Glance
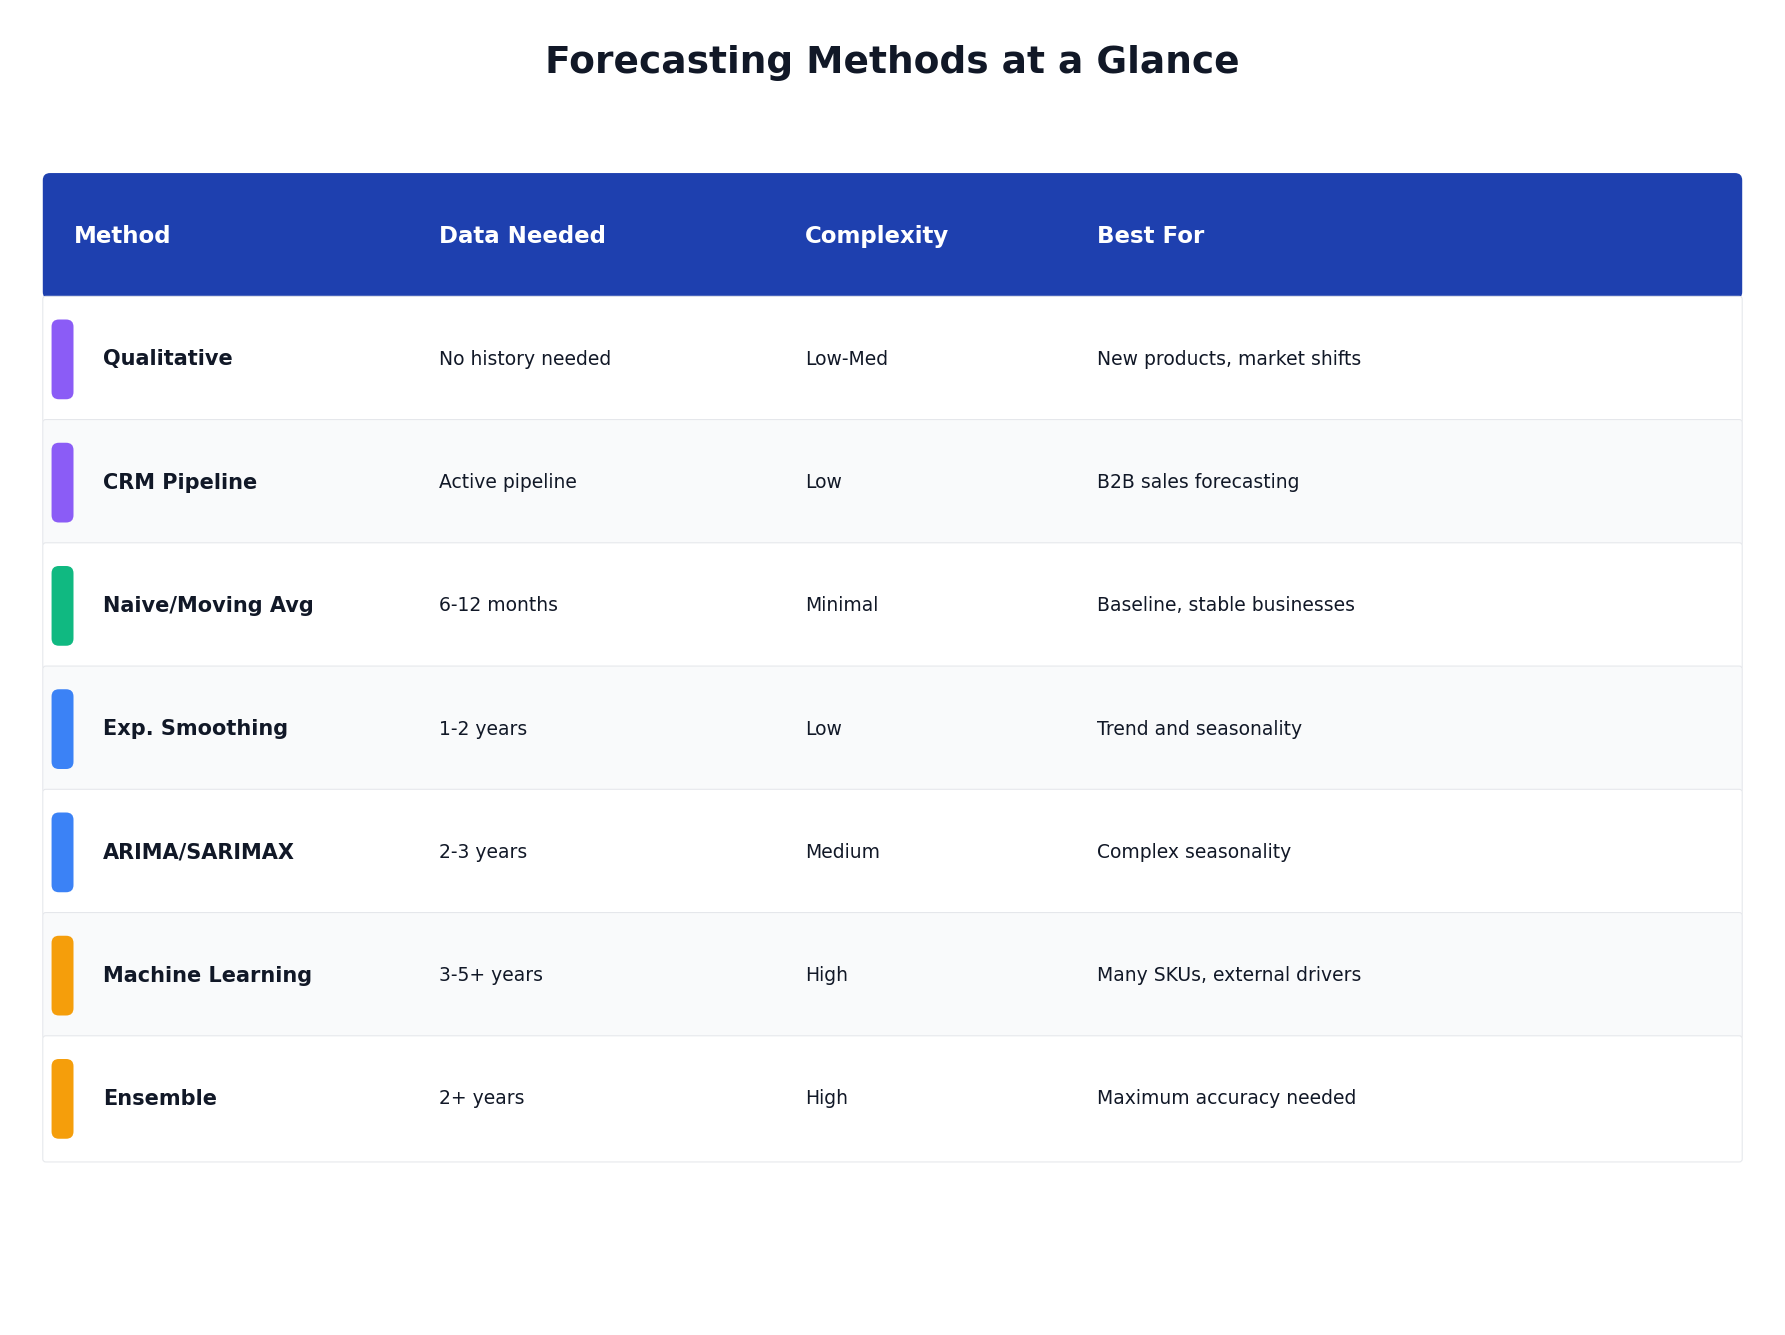 A quick reference for choosing between methods based on data requirements, complexity, and use case.
Common Pitfalls
Over-engineering. The most sophisticated method isn't always best. A well-tuned exponential smoothing model often beats a poorly implemented neural network. Start simple, add complexity only when it demonstrably improves accuracy.
Under-investing. The opposite mistake: using naive methods when your data clearly supports something better. If you have three years of seasonal data and you're still eyeballing spreadsheets, you're leaving accuracy on the table.
No feedback loop. If you don't measure forecast accuracy, you can't improve. Track your predictions against actuals, calculate error metrics, and use that feedback to refine your approach.
Confusing precision with accuracy. A forecast of €1,247,832.17 isn't more accurate than "roughly €1.2-1.3 million"—it just looks more precise. False precision breeds overconfidence. Embrace uncertainty; use ranges and confidence intervals.
Putting It Into Practice
Here's a pragmatic path forward:
Start with a naive baseline. Whatever method you choose, compare it against "next period = this period." If your method doesn't beat naive, simplify.
Match method to data. Don't use ML with 18 months of data. Don't use moving average when you have five years of rich history.
Measure religiously. Track MAPE, MAE, or whatever error metric fits your business. Review monthly.
Iterate gradually. Move from simple to complex only when the data justifies it and the accuracy improvement is meaningful.
Combine methods when possible. A simple ensemble (average of two methods) often outperforms either alone.
For tactical advice on getting more from whatever method you choose, see our guide on improving forecast accuracy.
Ready to forecast without choosing methods manually? Try Sanvia free for 14 days — upload your sales data and let the platform select and combine the best approaches automatically.