How to Improve Sales Forecast Accuracy: 8 Proven Techniques
A 10% error in your sales forecast might seem acceptable—until it translates into €200,000 of excess inventory or a missed growth opportunity. For SMEs operating on tight margins, forecast accuracy isn't a nice-to-have; it's the difference between confident decision-making and constant firefighting.
The good news? After analyzing over 1,000 real company revenue series, we've identified eight techniques that consistently reduce forecast error by 30-50%. None of them require a data science team or enterprise software. Here's what actually works.
1. Start with Clean Data
Every forecasting technique in this article assumes one thing: your historical data is reliable. If your input contains gaps, duplicates, outliers from one-time events, or inconsistent time periods, even the most sophisticated model will produce garbage.
Before forecasting, audit your data for:
- Missing periods — a skipped quarter will distort seasonality detection
- Outliers — that €2M deal in Q3 2022 might be a one-time event, not a trend
- Inconsistent definitions — did "revenue" mean the same thing three years ago?
We've written a detailed guide on preparing your data for accurate forecasts, including practical techniques for handling each of these issues.
2. Choose the Right Forecast Horizon
Here's an uncomfortable truth: all forecasts degrade over time. A prediction for next quarter will always be more accurate than one for three years from now. This isn't a failure of your model—it's a fundamental property of forecasting.
Our analysis of 1000+ company revenue series shows a clear pattern:
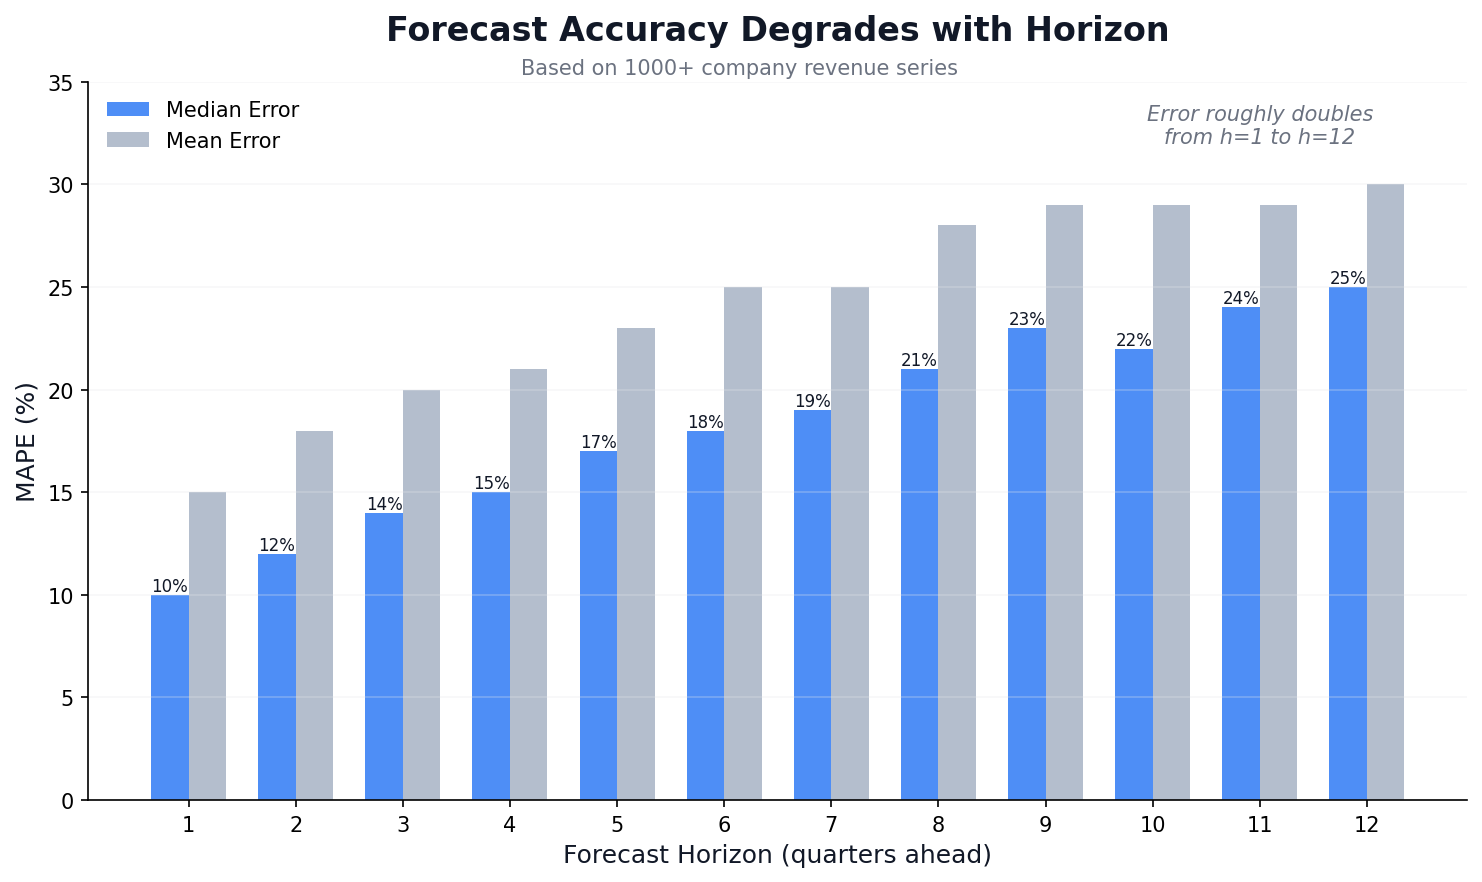
Median error roughly doubles from 10% at one quarter ahead to 25% at twelve quarters out. The degradation is gradual and predictable, which means you can plan for it.
Practical implications:
- Forecast only as far ahead as your decisions require
- If you need a 3-year view for strategic planning, acknowledge the wider uncertainty
- Use confidence intervals that widen over time—a point estimate at h=12 is false precision
3. Forecast at the Right Frequency
Quarterly revenue doesn't require daily forecasts. Monthly sales data shouldn't be forced into annual buckets. Matching your forecast frequency to your data's natural rhythm improves accuracy and reduces noise.
General guidelines:
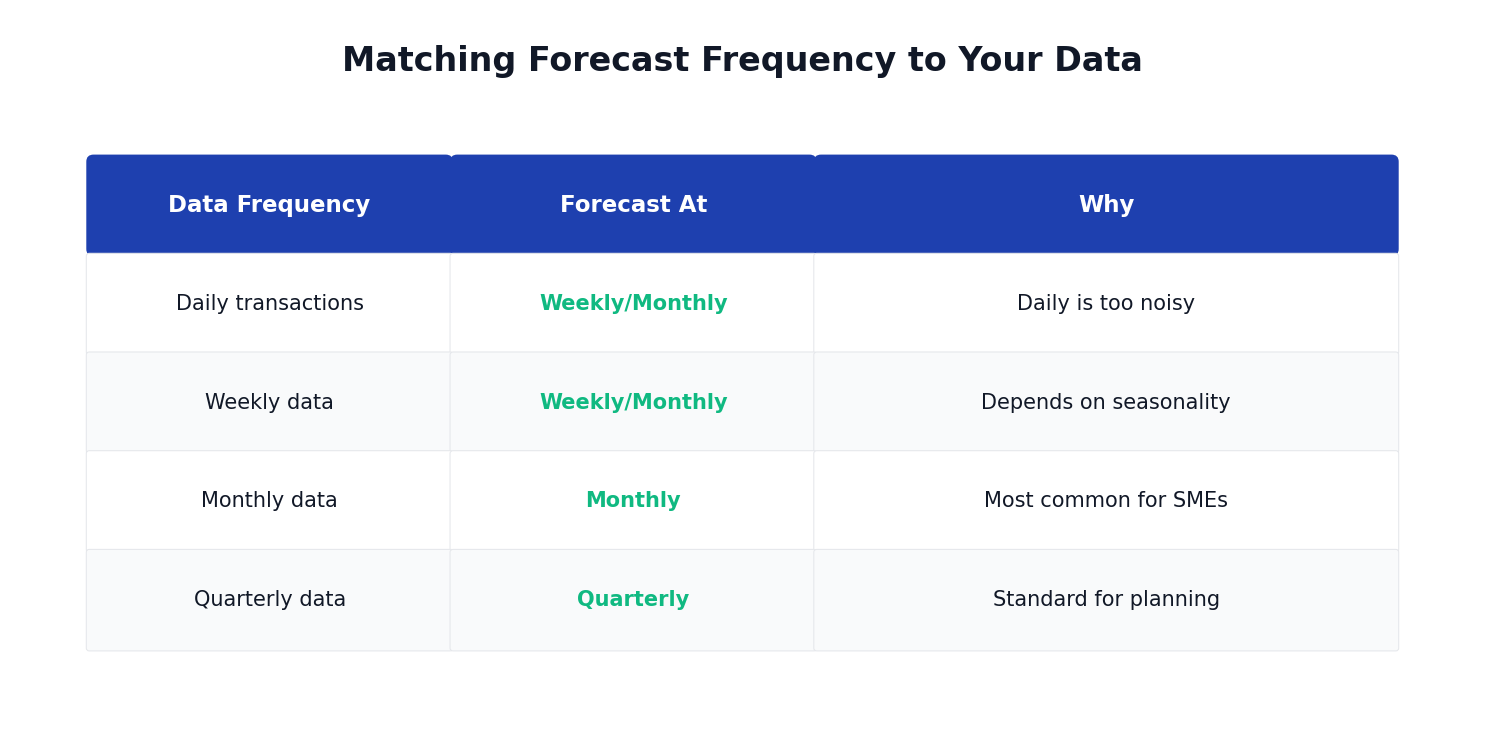
Forecasting at a higher frequency than your data supports creates spurious precision. Forecasting at a lower frequency than necessary discards useful signal. When in doubt, match the frequency at which you make business decisions.
4. Reforecast Regularly (Don't "Set and Forget")
This is the single highest-impact technique we've found. A forecast created once and never updated will drift further from reality with each passing period. A forecast refreshed with new actuals stays accurate.
We compared two approaches across our test dataset:
- Static: Train once, forecast all 12 quarters ahead
- Rolling: After each quarter's actual comes in, retrain and forecast the next quarter
The results were striking:
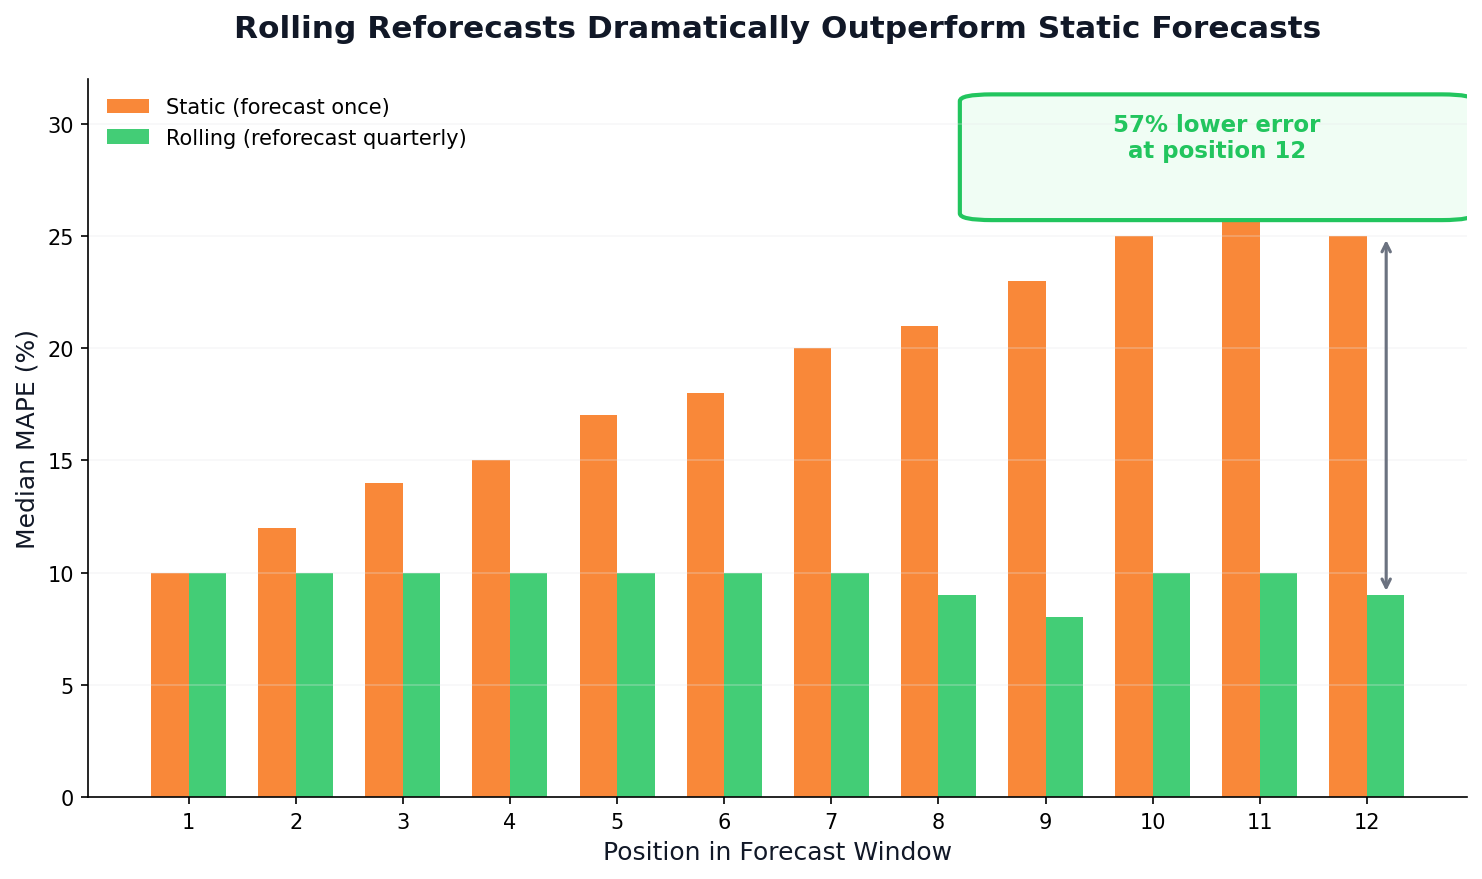
At position 12 in the forecast window, rolling reforecasts showed 57% lower error than static forecasts. The rolling approach maintains roughly 10% MAPE throughout, while static forecasts degrade to 25%+.
Why this works: Each rolling iteration is effectively a fresh short-horizon forecast with the latest information. The model doesn't accumulate drift because it's constantly recalibrated.
Practical advice:
- Refresh forecasts quarterly at minimum, monthly if your data supports it
- Automate the refresh—manual processes get forgotten
- Think of it as "feeding" your forecast new information, not starting over
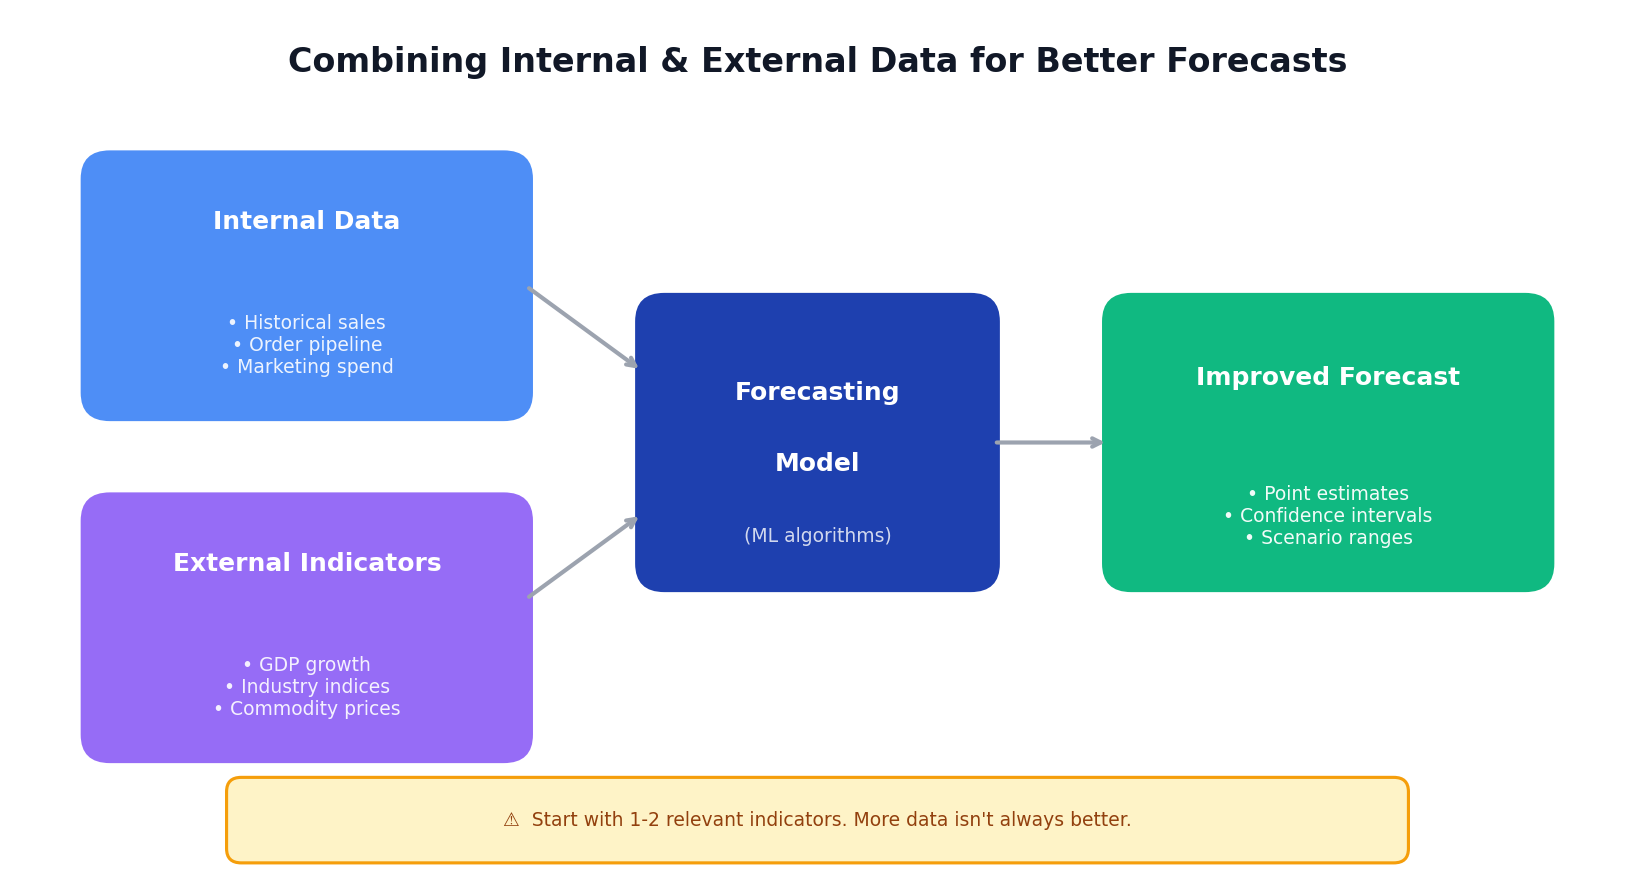
5. Leverage External Indicators
Your sales don't exist in a vacuum. They respond to economic conditions, industry trends, commodity prices, and competitive dynamics. Incorporating relevant external data can improve forecasts, especially for longer horizons where internal patterns become less reliable.
Useful external indicators:
- Macroeconomic: GDP growth, inflation, interest rates, consumer confidence
- Industry-specific: sector indices, commodity prices, regulatory changes
- Leading indicators: housing starts (for construction), PMI (for manufacturing)
When external data helps most:
- Longer forecast horizons (6+ quarters)
- Businesses sensitive to economic cycles
- Products tied to commodity prices
Cautions:
- More data isn't always better—irrelevant indicators add noise
- Correlation isn't causation; validate that the relationship makes business sense
- Consider lag: GDP published today reflects last quarter's activity
Start with one or two indicators that clearly relate to your business, validate their impact on historical accuracy, and expand carefully from there.
6. Use Bottom-Up Forecasting
Instead of forecasting total company revenue as a single number, forecast by product line, region, customer segment, or sales channel—then aggregate upward.
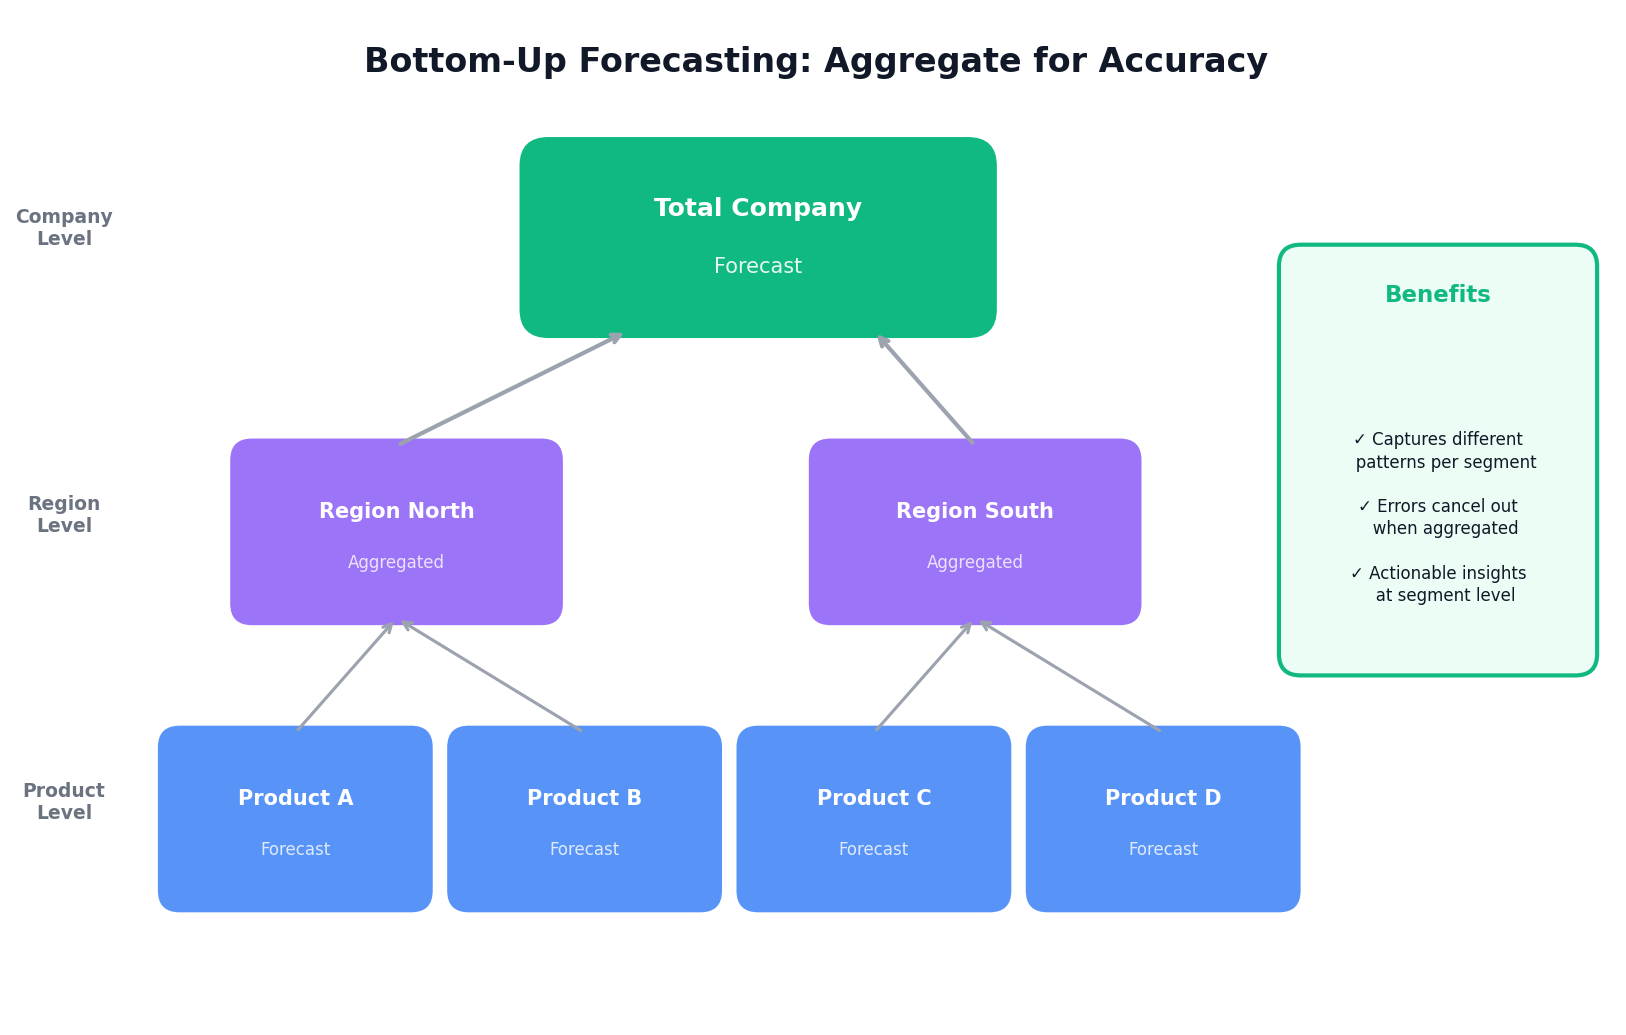
Why this works:
- Different patterns: Your subscription revenue might be stable while project revenue is volatile; a single model can't capture both
- Error cancellation: Overestimates in one segment often offset underestimates in another
- Actionable insights: Knowing which products are growing matters more than just total revenue
We've covered the technical implementation in our guide to multi-column forecasting, including how to handle hierarchical data and reconciliation.
When top-down still makes sense:
- New products with no history
- Segments with very sparse data
- When segment-level data quality is poor
7. Combine Multiple Models (Ensemble Approach)
No single forecasting model dominates across all scenarios. Trend-focused models excel when direction matters. Seasonal models capture cyclical patterns. Simple models avoid overfitting on short series.
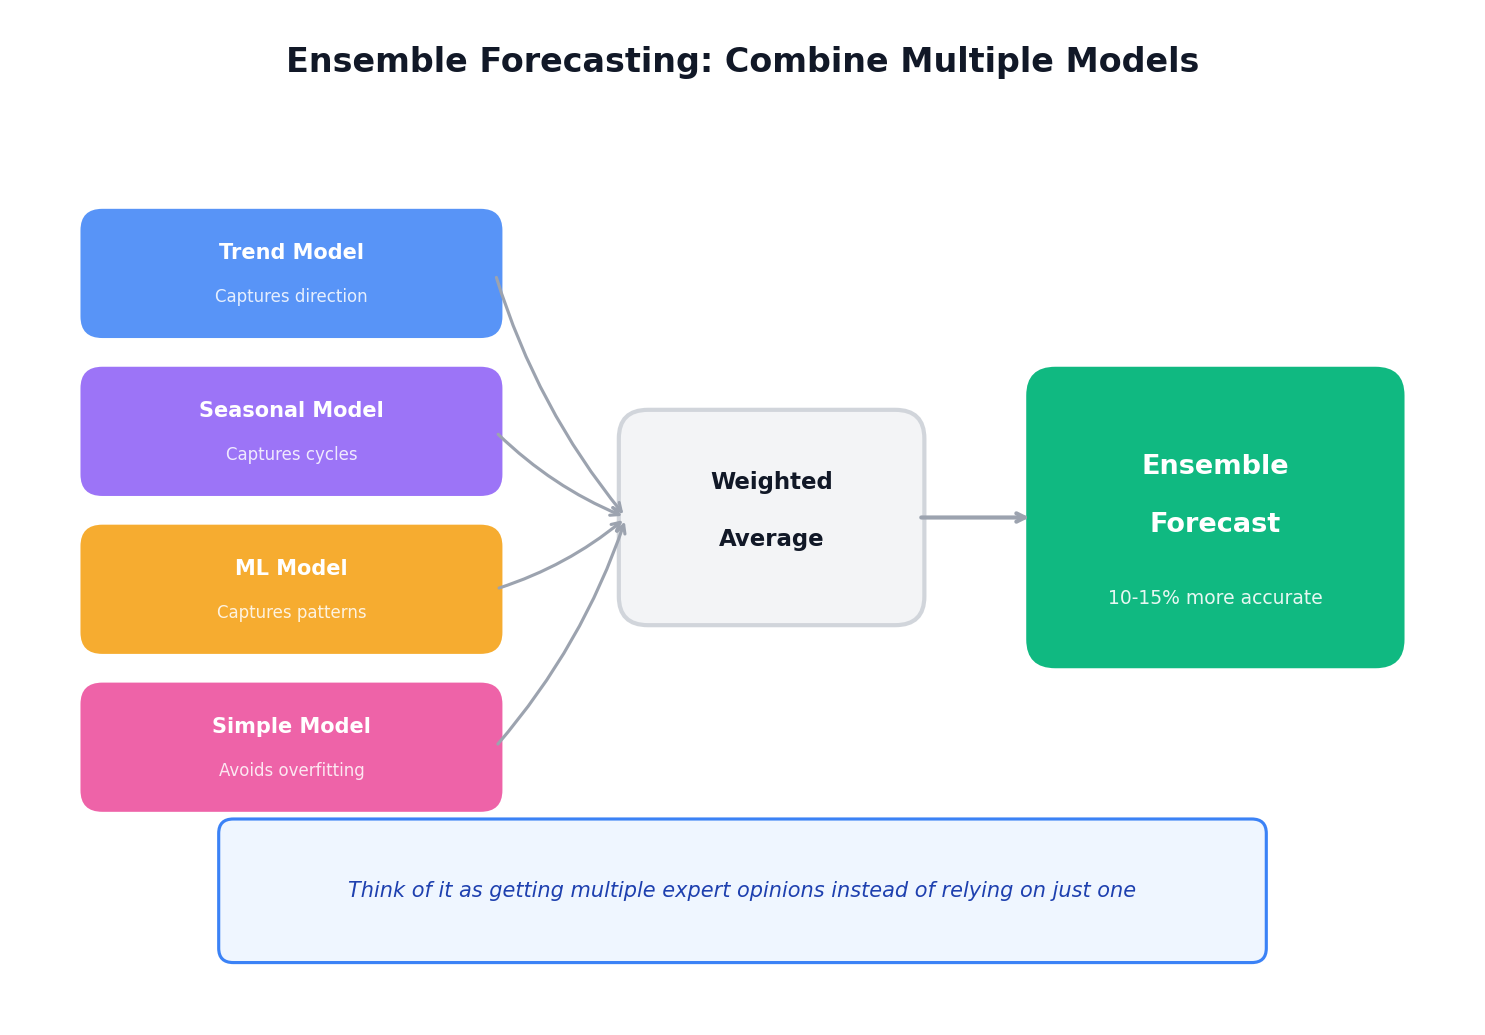
Combining forecasts from multiple models—an ensemble approach—typically outperforms any individual model by 10-15%. The ensemble averages out individual model biases and captures different aspects of the underlying pattern.
You don't need to understand the math. Think of it as getting multiple expert opinions and weighing them together, rather than betting everything on one perspective.
Our detailed guide on ensemble forecasting explains different combination strategies and when to use them.
8. Apply Human Judgment—Carefully
Models extrapolate from historical patterns. They don't know about the contract you just signed, the competitor that just entered your market, or the regulation that takes effect next quarter.
Human judgment overlay is valuable when:
- You have concrete information the model can't see (signed contracts, known events)
- Market conditions have fundamentally shifted
- The model produces results that contradict clear business logic
Human judgment is dangerous when:
- It's based on optimism or anchoring to last year's plan
- It's applied inconsistently ("I'll adjust this one because it looks wrong")
- It overrides the model routinely rather than exceptionally
Best practice: Document every manual adjustment with a specific rationale. Review adjustments retrospectively to see if they improved or degraded accuracy. Most organizations find they adjust too much, not too little.
Know Your Data's Limits
A final, humbling point: some series are simply harder to forecast than others. A business with steady subscription revenue and mild seasonality will always be more predictable than one with lumpy project-based sales and high customer concentration.
The coefficient of variation (CV)—standard deviation divided by mean—is a quick diagnostic. In our analysis, series with CV above 1.5 showed median forecast errors 2-3x higher than low-CV series, regardless of model choice.
Use this to:
- Set realistic expectations with stakeholders
- Allocate forecasting effort where it pays off
- Identify segments that may need different approaches (scenario planning vs point forecasts)
Putting It All Together
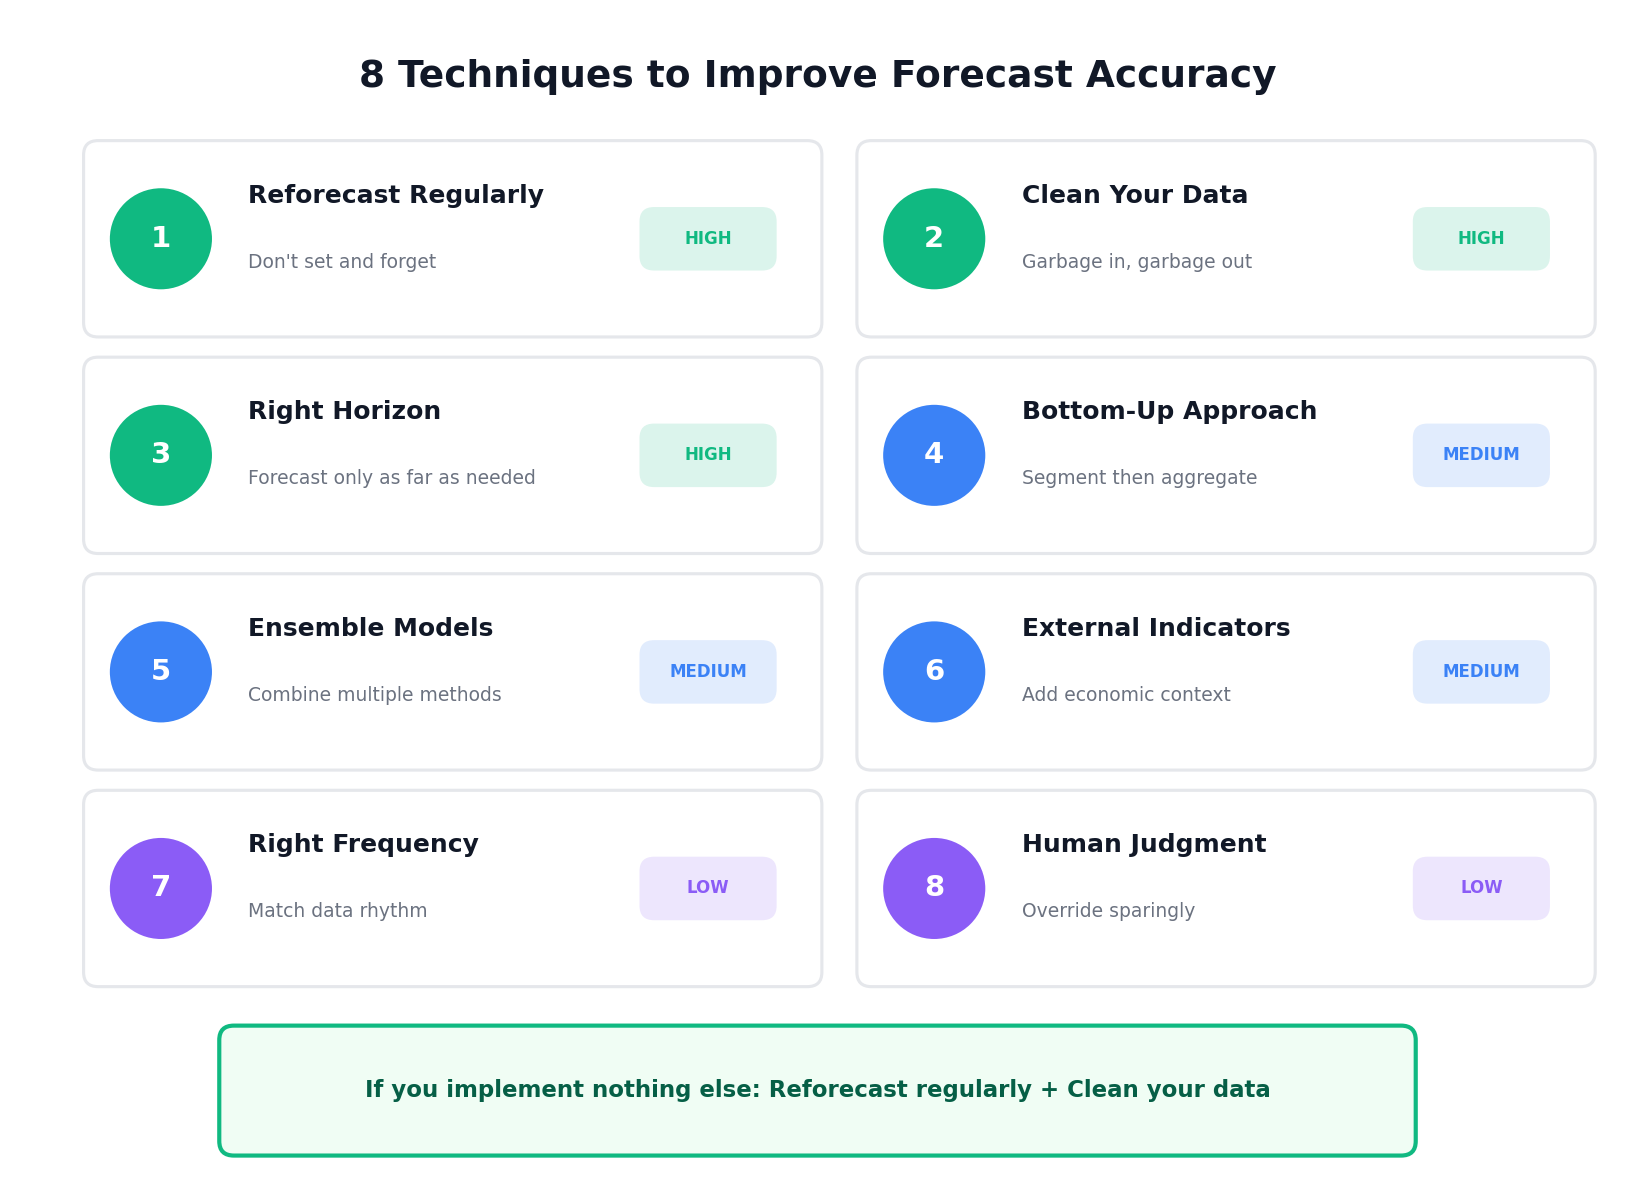
If you implement nothing else from this article:
- Reforecast regularly — the single biggest accuracy lever
- Clean your data — garbage in, garbage out
- Match horizon to need — don't forecast further than necessary
The remaining techniques—external indicators, bottom-up disaggregation, ensembles, frequency matching, and judgment overlay—provide incremental gains and are worth pursuing as your forecasting practice matures.
Take Your Forecasting Further
Building these techniques into your workflow takes time—or the right tools. Sanvia automates data cleaning, model selection, ensemble combination, and reforecasting in a platform designed for SMEs. No data science team required.
Upload your historical sales data and get your first AI-powered forecast in minutes.
Ready to improve your forecast accuracy? Start your free trial and see these techniques in action.